
- The price of silver rose more than 1%, buoyed by the dovish speech from the Federal Reserve, Jerome Powell.
- Dollar weakness and plunging US Treasury yields a tailwind for XAG/USD.
- Silver Price Analysis: Once above $22.00, a recovery above $23.00 is expected.
the price of silver It soars more than 2% after the perceived “dovish” speech by Federal Reserve (Fed) Chairman Jerome Powell, which laid the groundwork for a smaller rate hike on Wednesday. The US economic calendar showed mixed data, undermining the US dollar (USD), as evidenced by the rise in precious metals and most currency pairs. At the time of writing, XAG/USD is trading at $22.55.
Upbeat sentiment, dovish Fed and mixed US data weighed on the dollar
Trader sentiment remains upbeat following Powell’s speech. The Federal Reserve chairman said “the time to ease the pace of rate hikes may come as soon as the December meeting,” fueling dollar weakness and sending silver prices higher. He added that most Fed policymakers wouldn’t want to “tighten too much,” saying he doesn’t want to cut rates any time soon.
In terms of data, the Institute for Supply Management (ISM) revealed that US manufacturing activity fell to 49.0 below estimates of 49.2 and fell below October’s reading of 50.2, the lowest since May 2020. Normally, when the Manufacturing PMI falls below 50, activity is in contractionary territory. However, a lower reading would help control inflation, although it opens the door for a recession.
Earlier, the US Department of Commerce (Doc) revealed that the Fed’s preferred inflation gauge, US Core Personal Consumption Expenditure (PCE), rose 5% year-over-year, below the reading of 5.2% from the previous month, and in line with the consensus. At the same time, the US Department of Labor revealed that initial claims for jobless benefits for the week ending November 26 rose by 225,000, below the 235,000 expected by analysts and less than the US reading. The last week.
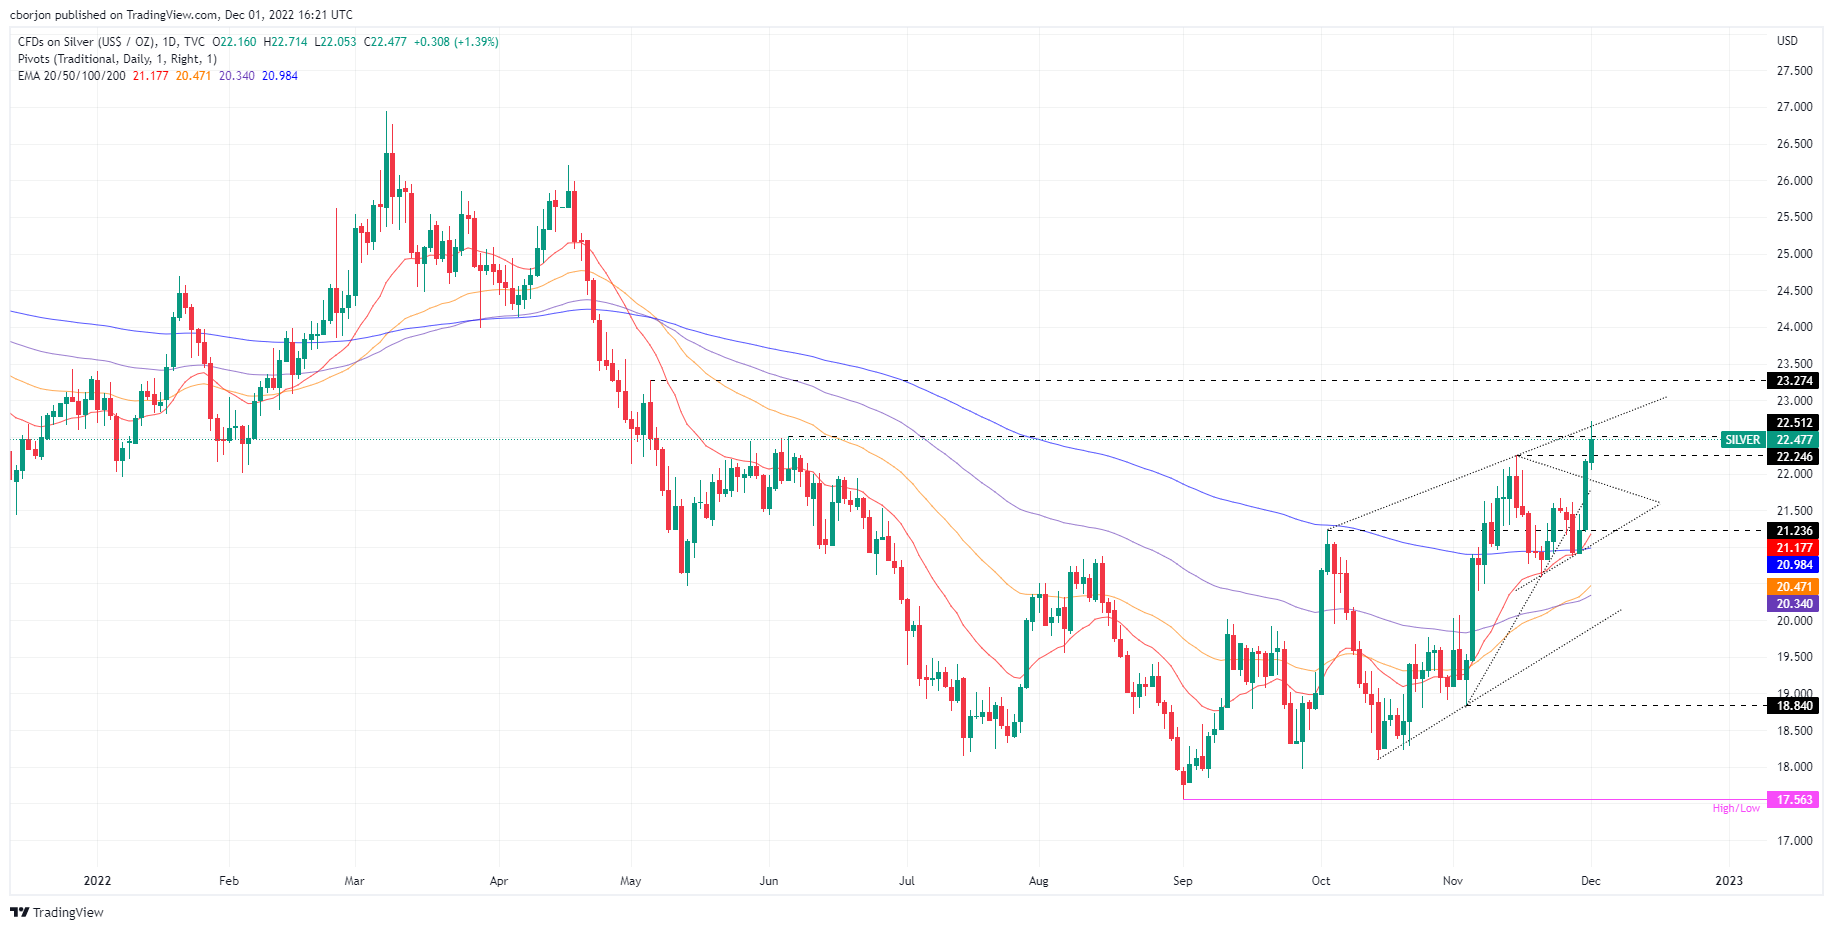
Silver Price Analysis: Technical Perspective
From a daily chart perspective, XAG/USD is biased to the upside and is trading above the daily EMAs. After bottoming out around year-to-date (YTD) lows around $17.56, the white metal continued an upward trajectory, initially failing to break above the Oct. 4 high of $21.23. Still, once broken, XAG/USD approached the psychological $22.00 level. That being said, the path of least resistance for silver prices is to the upside.
The first resistance for XAG/USD is the June 6 high of $22.51, followed by $23.00, before the May 5 high of $23.27.
Source: Fx Street
I am Joshua Winder, a senior-level journalist and editor at World Stock Market. I specialize in covering news related to the stock market and economic trends. With more than 8 years of experience in this field, I have become an expert in financial reporting.


