
- The XAG/USD pair chains its second consecutive day of gains and hits a four-day high of $22.88.
- Market caution ahead of central bankers’ speeches at ECB Forum gives silver traction.
- Falling US yields mean precious metals find demand.
On Monday, the pair XAG/USD it recovered to the 200-day simple moving average (SMA) at $22.52 and reached a high of $22.88. This rally in silver prices can be attributed to a cautious market sentiment ahead of upcoming speeches by central bankers at the European Central Bank (ECB) Forum in Sintra. Furthermore, declining US yields have led to increased demand for precious metals, further supporting the bullish momentum in Silver.
Falling yields ahead of ECB forum favor commodity prices
The ECB Forum in Sintra has kicked off, and Christine Lagarde will deliver a speech on Monday. On Wednesday it will be the turn of Jerome Powell, of the Federal Reserve (Fed), and Andrew Bailey, governor of the Bank of England (BoE). Investors will look for clues as to the future stance of each bank’s respective monetary policies and as out-yielding precious metals tend to be negatively correlated with higher interest rates, hawkish clues could put downward pressure on silver. .
Meanwhile, US 10-year bond yields and the DXY Index fell, causing XAG/USD to find demand. That said, the quoted yield fell 0.54% to 3.71%, while the Dollar Index settled at 102.75 and posted slight losses.
XAG/USD Levels to Watch
According to the daily chart, the technical outlook for the XAG/USD remains neutral to bearish for the short term. The Relative Strength Index (RSI) and Moving Average Divergence (MACD) gained some traction in negative territory, but in the bigger picture the sellers are in charge.
Support levels to watch: $22.52 (200-day SMA), $22.40, $22.10 (March low).
Resistance levels to watch: $23.00, $23.34 (100-day SMA), $23.52 (20-day SMA).
XAG/USD Daily Chart
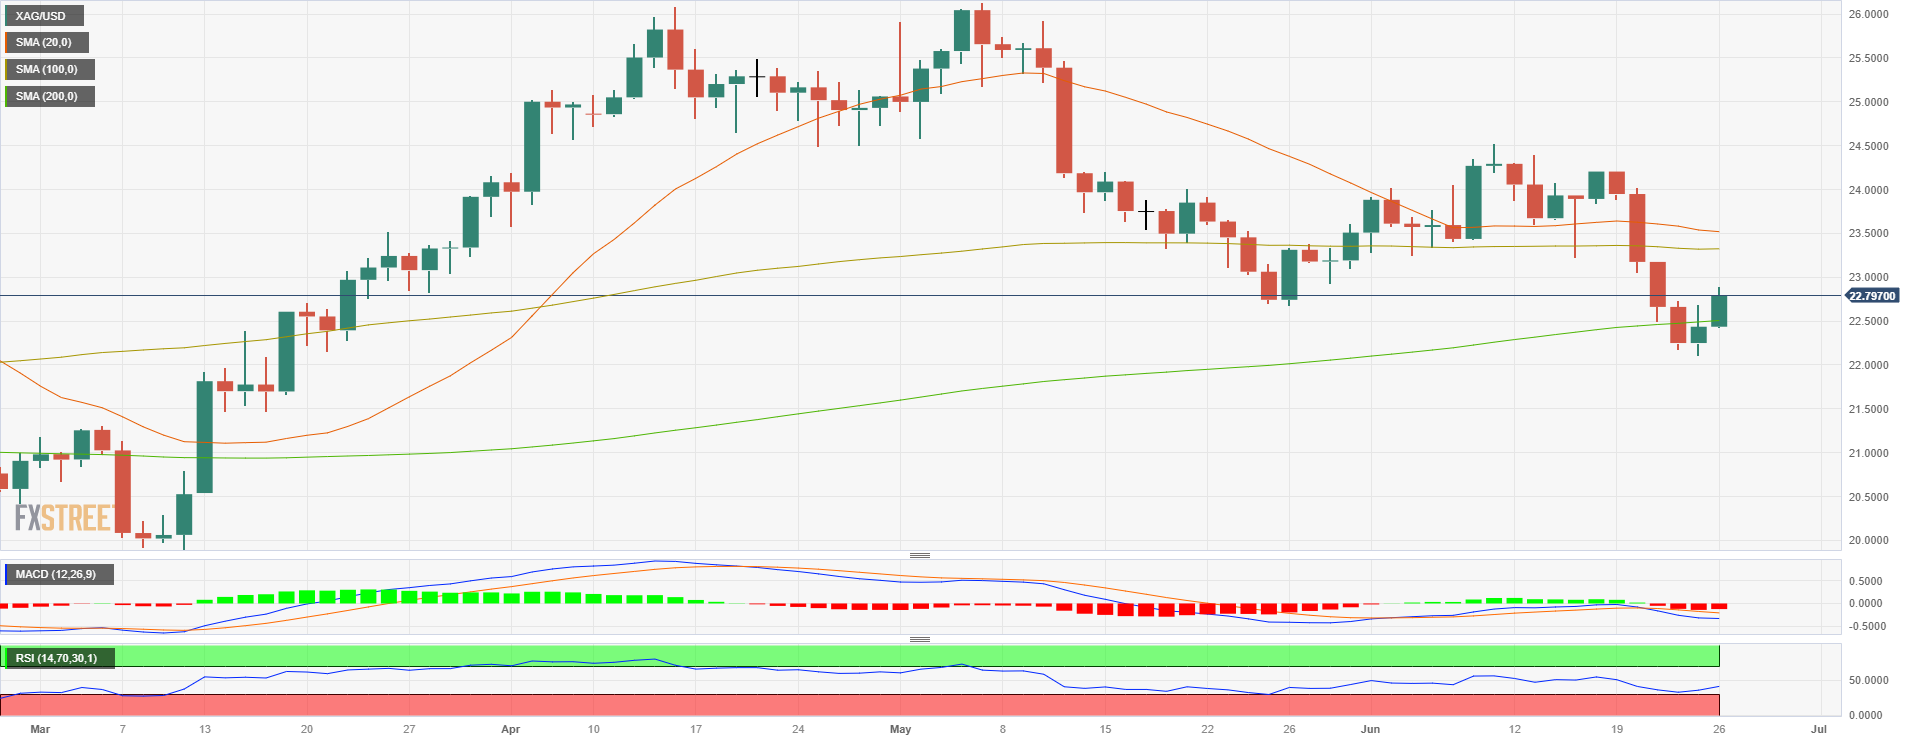
Source: Fx Street
I am Joshua Winder, a senior-level journalist and editor at World Stock Market. I specialize in covering news related to the stock market and economic trends. With more than 8 years of experience in this field, I have become an expert in financial reporting.


