
- XAG/USD is at risk of a bearish pattern and double top formation as the price pulls back from a 12-month high.
- A bearish trajectory is anticipated, with crucial support levels at $25.00 and $24.00 amid fading momentum buying.
The price of silver falls back after hitting a new 12-month high of $26.13 in the American session. The improvement in the US labor market on the back of the upbeat US jobs report dashed the XAG’s chances of testing last year’s high. At the time of writing these lines, the pair XAG/USD trades at $25.60, losing 1.69%.
XAG/USD Price Action
At the time of writing, the XAG/USD pair is still on the rise, but on the verge of turning back. If XAG/USD records a daily close below the May 4 daily low of $25.44, this could form two bearish signals: first, a bearish engulfing candlestick pattern that suggests bearish action is warranted. The second is the possible formation of a double top, a major reversal chart pattern, which could push prices towards $24.00.
The Relative Strength Index (RSI) added another signal to the mix, forming a negative divergence. This means that as the XAG/USD price action made successive higher highs, the RSI made lower highs as buying momentum faded. Also, the 3-Day Rate of Change (RoC) shows that the buying pressure is easing as the sellers get in on the action.
Therefore, the path of least resistance for XAG/USD is to the downside. The first support would be the $25.00 signal. A break of the latter would expose the April 25 low at $24.49, followed by the 50-day EMA at $24.11, which, once broken, will challenge the $24.00 figure.
XAG/USD Daily Chart
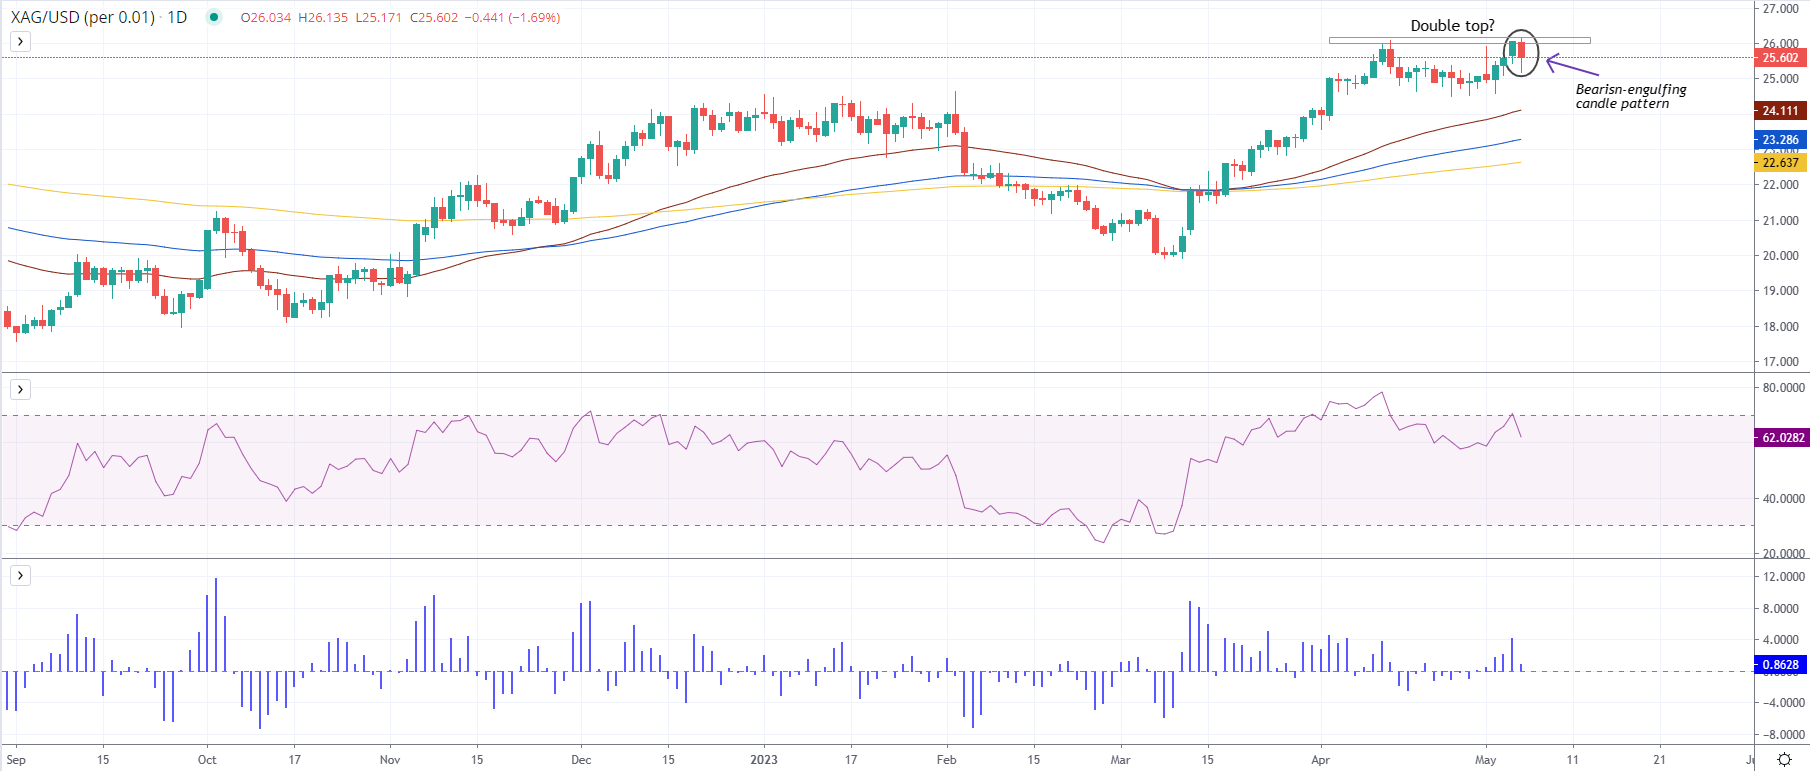
Source: Fx Street
I am Joshua Winder, a senior-level journalist and editor at World Stock Market. I specialize in covering news related to the stock market and economic trends. With more than 8 years of experience in this field, I have become an expert in financial reporting.


