
- Silver Price Drops from $26.80 as US Dollar and Bond Yields Rebound Ahead of US Jobs Data
- US jobs data will influence speculation about Fed rate cuts in June.
- The Fed remains confident of cutting rates this year even though progress on disinflation has stalled.
The price of the Silver (XAG/USD) pulls back sharply to $26.26 as it attempts to reclaim the crucial resistance at $27.00 during the European session on Thursday. The white metal faces pressure from the US dollar and bond yields, which are trying to recover amid uncertainty over the US Non-Farm Payrolls (NFP) and ISM Services PMI data for April , which will be published on Friday.
The US NFP data would significantly influence market expectations for Federal Reserve (Fed) rate cuts from the June meeting. Economists have anticipated that American employers hired 243,000 jobs, down from the 303,000 additions recorded in March. The unemployment rate is expected to remain at 3.8%.
Investors will pay special attention to average hourly earnings in the United States. Average annual hourly earnings are expected to have grown at a slower pace of 4.0%, down from 4.1% in March, with steady growth of 0.3% month-on-month. Average hourly earnings are a leading indicator of wage growth, indicating the current state of household spending and ultimately influencing price pressures.
The US Dollar Index (DXY) bounces to 105.75 and the 10-year Treasury yield rises to 4.61%. The US dollar and bond yields fell on Wednesday after the Federal Reserve (Fed) was less aggressive than feared. The Fed remains optimistic about possible rate cuts this year, despite the risks of slowing the disinflation process.
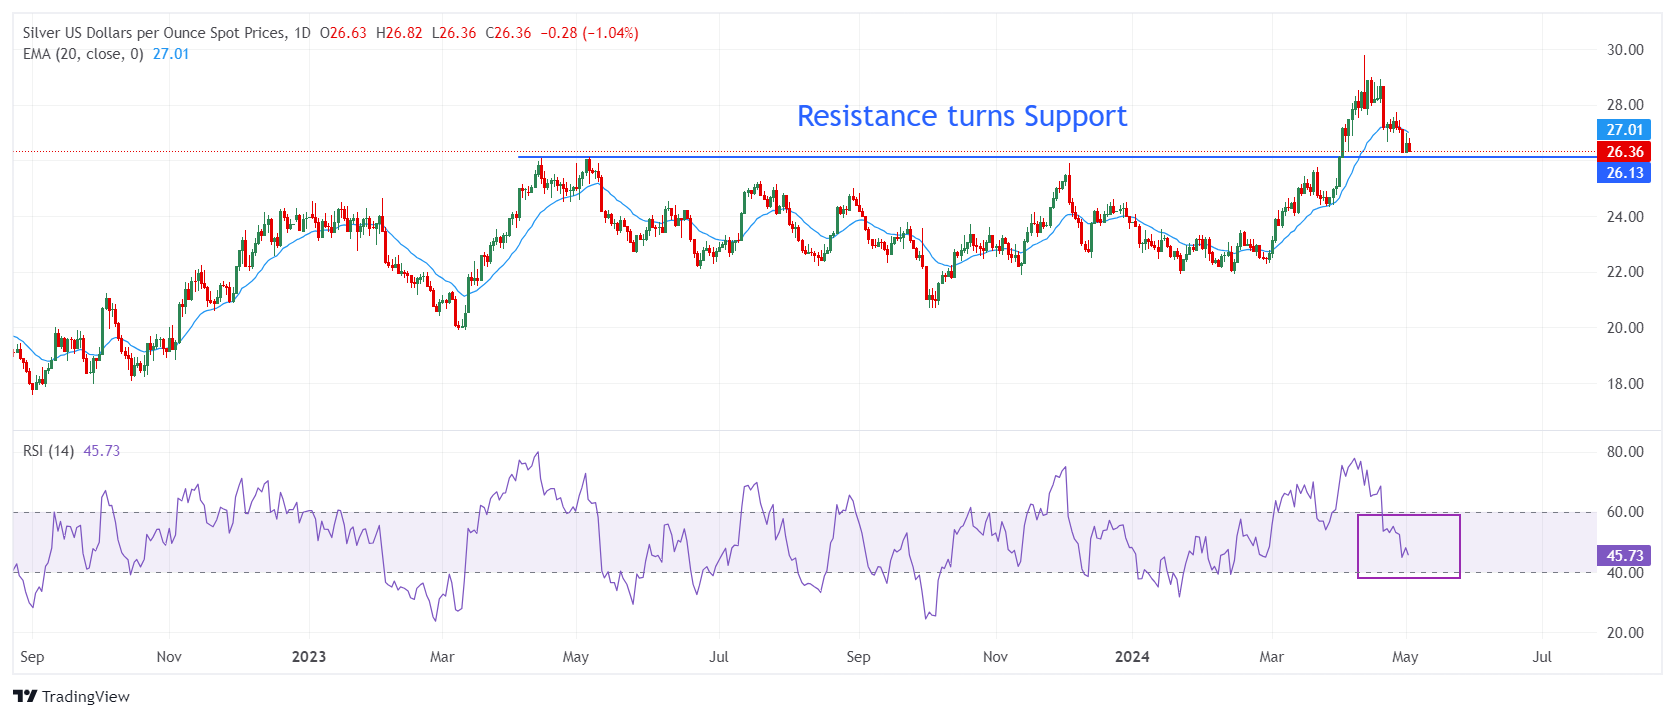
Silver technical analysis
The price of Silver falls near the horizontal support drawn from the April 14, 2023 high around $26.09 on a daily time frame. The aforementioned support was a major resistance for the Silver price bulls. Uncertainty over Silver's short-term prospects is heightened as it has fallen below the 20-period EMA, which is trading around $27.20.
The 14-period RSI declines towards the 40.00-60.00 range, suggesting that the bullish momentum has faded. However, the long-term outlook remains stable.
Silver Daily Chart
Source: Fx Street
I am Joshua Winder, a senior-level journalist and editor at World Stock Market. I specialize in covering news related to the stock market and economic trends. With more than 8 years of experience in this field, I have become an expert in financial reporting.


