
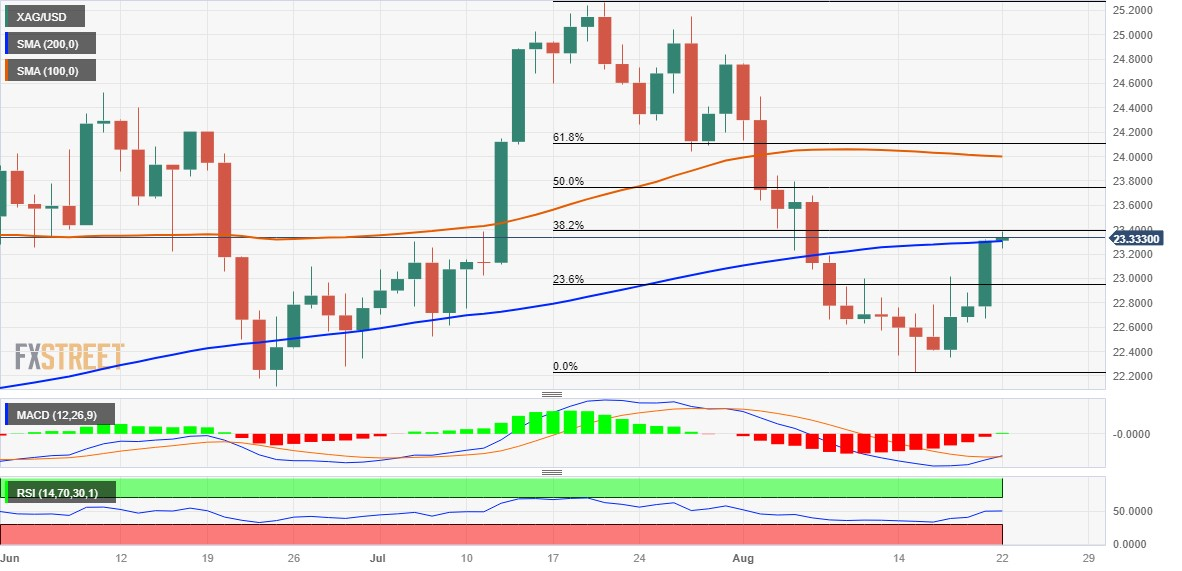
- Silver price pauses its three-day uptrend near the 38.2% Fibonacci resistance.
- The technical situation supports the prospects of a further appreciation movement in the short term.
- Any significant drop could be considered a buying opportunity near the $23.00 level.
The price of Silver (XAG/USD) enters a bullish consolidation phase and oscillates in a tight range around the $2.30 zone, just below its highest level in more than two weeks that it touched earlier in the day. of this Tuesday.
From a technical perspective, XAG/USD, for now, appears to have halted its recent rally from the $22.20 zone, or nearly two-month low, near resistance signaled by the 38.2% Fibonacci retracement of the $22.20 drop. July August. A sustained strength beyond said barrier will be seen as a new trigger for the bulls and pave the way for a further appreciation move in the short term.
Given that the oscillators on the daily chart have just started moving into positive territory, XAG/USD could rally to the 50% Fibonacci resistance near the $23.75 zone. Momentum could extend to the $24.00-$24.10 confluence, which comprises the 100-day SMA and the 61.8% Fibonacci. Some continuation buying will suggest that the nearly month long slide is over.
On the flip side, any significant pullback now seems to find decent support near the round $23.00 level, which now coincides with the 23.6% Fibonacci. This is followed by the $22.70-$22.65 support zone, which if broken decisively will expose the multi-month low around the $22.10 zone hit in June. Next is the $22.00 level, below which XAG/USD could slide to the $21.55-$21.50 area.
The downside could extend further towards the round $21.00 level en route to the $20.60 area, below which XAG/USD could drop and challenge the psychological $20.00 level.
silver daily chart
Silver additional technical levels
Source: Fx Street
I am Joshua Winder, a senior-level journalist and editor at World Stock Market. I specialize in covering news related to the stock market and economic trends. With more than 8 years of experience in this field, I have become an expert in financial reporting.


