
- XAG/USD breaks monthly highs amid positive market sentiment, despite rising dollar.
- US core PCE disappointed expectations, opening the door for a less hawkish Fed.
- XAG/USD Price Analysis: Expected to continue its rally and test the $24.63 high.
The price of the Silver It is trading at new monthly highs above $24.00 a troy ounce, helped by falling US Treasury yields. Sentiment remains the main driver for the session, with US stocks poised to end the month with gains. At the time of writing, the XAG/USD pair is trading at $24.10, with a gain of 0.89%.
Fed’s Collins welcomes the inflation data, but reiterates that the Fed still has work to do
Wall Street continues to print gains across the board. The Dollar is pressured by data from the United States (US), which showed a moderation in inflation; therefore, less aggressiveness is needed from the US Federal Reserve (Fed).
The Department of Commerce (DoC) released the Fed’s preferred inflation gauge, Core Personal Consumption Expenditure (PCE) for February, which rose 4.6% year-on-year, below estimates of 4.7%, while the headline inflation fell from 5.3% to 5% year-on-year.
Consequently, US Treasury yields fell, favoring the white metal, which breached the $24 threshold for the first time since February 2. The 10-year US Treasury yield fell four basis points to 3.516%, while the US real yield stood at 1.26% as of March 30.
Meanwhile, the University of Michigan (UM) Consumer Sentiment for the month of March was lower than expected, standing at 62, versus the 67 forecast. In addition, the survey updated that US consumers revised their inflation expectations downward. For the one-year horizon, the estimated inflation rate is 3.6%, while for the 5-year horizon, consumers estimate that inflation will be 2.9%.
On the central bank side, Boston Fed President Susan Collins stated that the PCE inflation data is positive, although there is still work to be done to bring inflation closer to the 2% target.
XAG/USD Technical Analysis
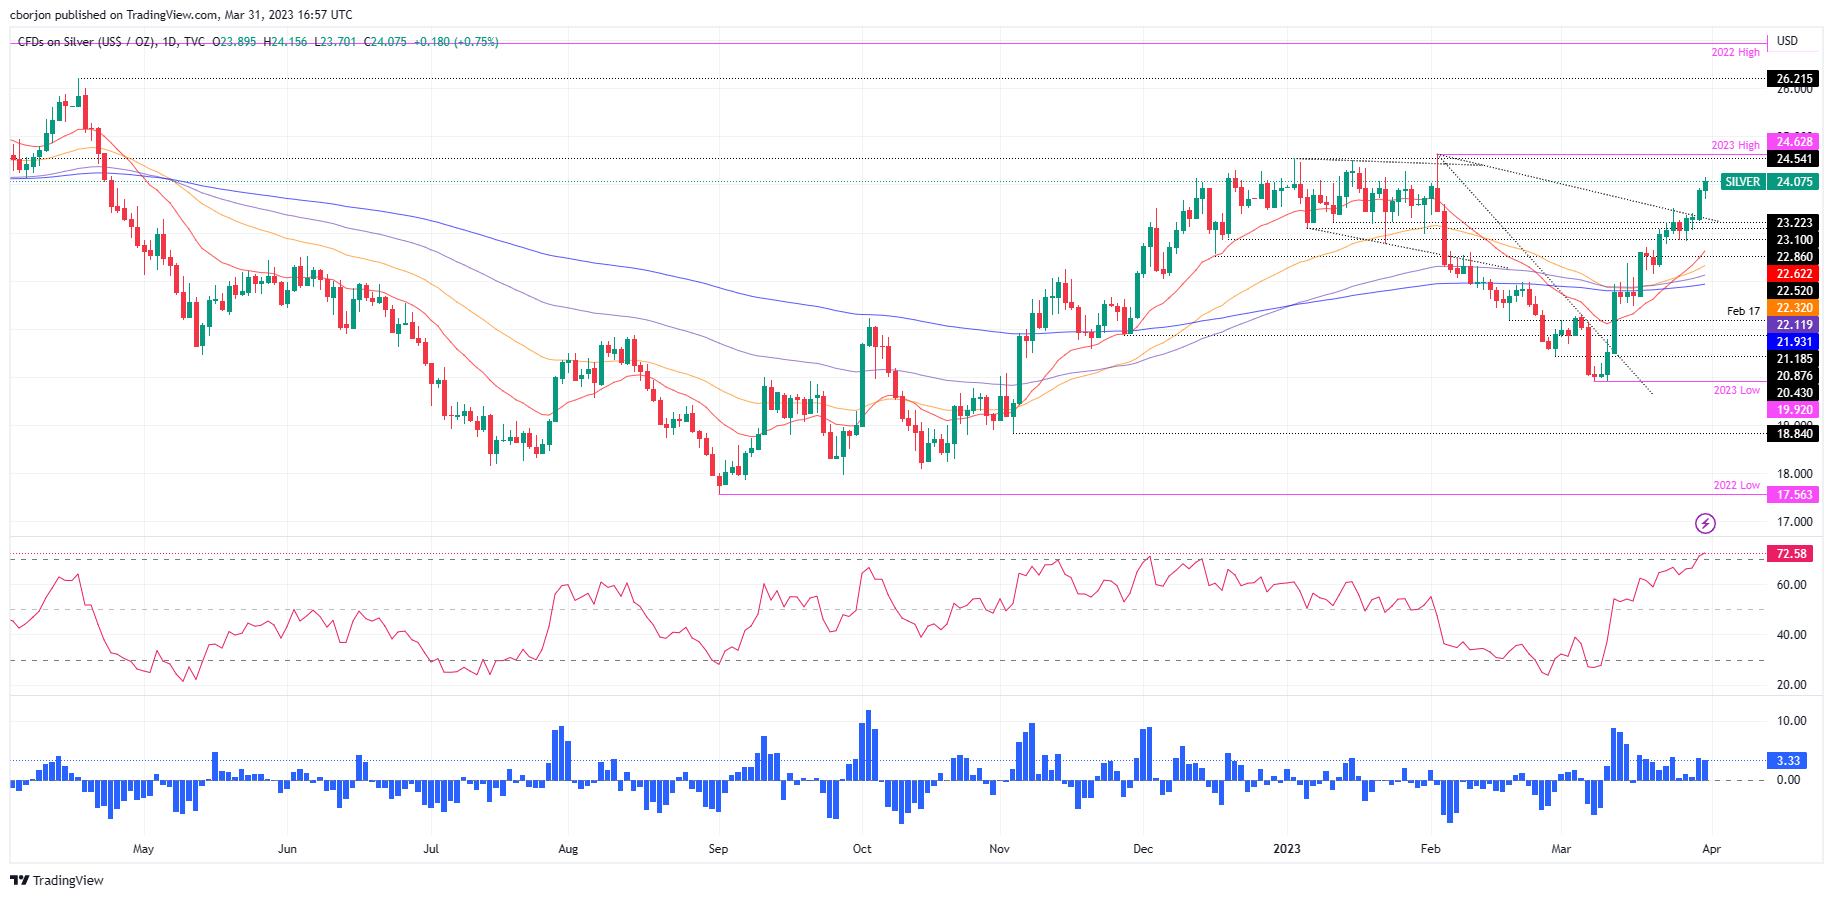
Given the background, XAG/USD is ready to extend its rally and test the year high at $24.63. The Relative Strength Index (RSI), albeit in overbought conditions, supported the uptrend, while the Rate of Exchange (RoC) portrays buyers huddled around the $22.00 area. XAG/USD could consolidate as RSI breaks out of overbought conditions as buyers prepare to test $25.00. If XAG/USD breaks above $24.63, the psychological barrier of $25.00 would be exposed. Once broken, on April 18, 2022, resistance at $26.21 is next.
Source: Fx Street
I am Joshua Winder, a senior-level journalist and editor at World Stock Market. I specialize in covering news related to the stock market and economic trends. With more than 8 years of experience in this field, I have become an expert in financial reporting.


