
- Silver dips below the 200 day EMA, extending its losses to two days in a row.
- Stronger than estimated Retail Sales increased appetite for the US dollar.
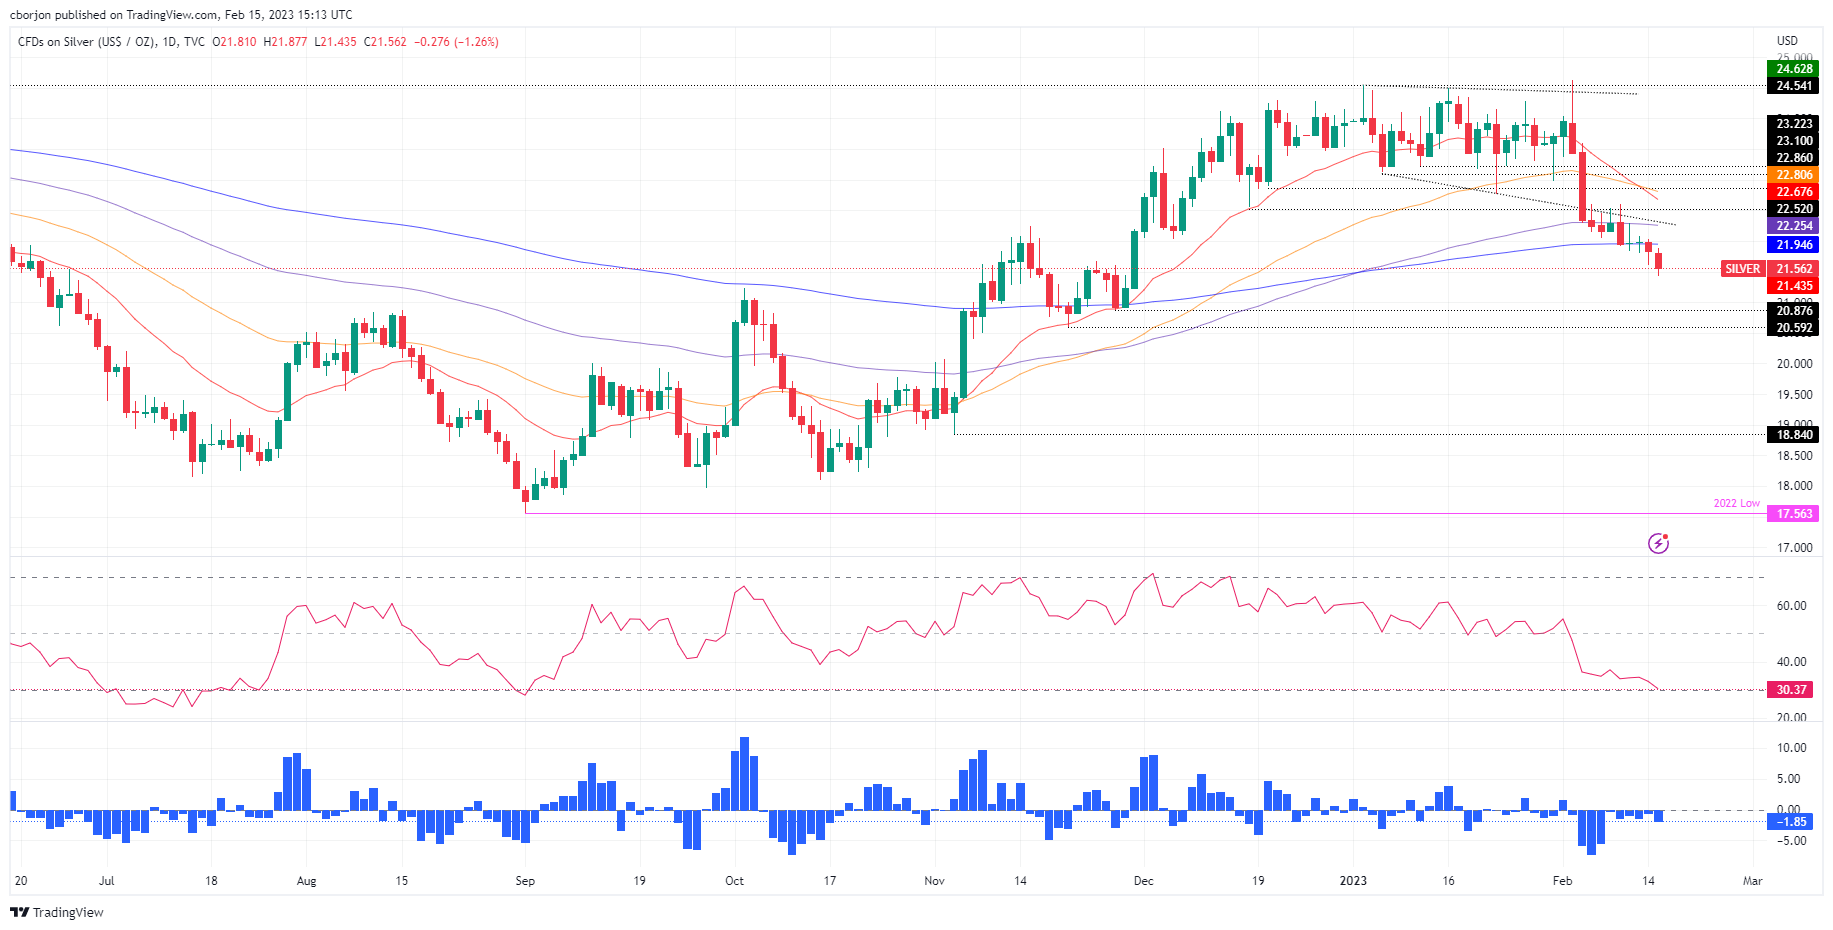
- XAG/USD Price Analysis: Turned bearish once it broke away from the 200 day EMA, with an eye on $21.00.
The price of silver extended its losses for the second day in a row and moved away from the 200-day EMA which rests at $21.50, as US economic data from the Commerce Department revealed that Retail Sales improved. Therefore, the US dollar (USD) is making its case for a comeback. At the time of writing these lines, the XAG/USD trades at $21.50 after reaching a high of $21.87.
US economic data justifies further tightening by the Federal Reserve
XAG/USD continues to fall, weighed down by the strength of the dollar, which, supported by higher US Treasury yields, is up 0.64% to 103.93, according to the Dollar Index. The 10-year US Treasury yield rises three and a half points to 3.772%, putting a headwind for the unprofitable metal.
US retail sales for January rose a surprising 3.0%m/m versus analyst estimates of 1.8%, after two straight months of contraction. The increase in sales is mainly attributed to the tight labor market, which continues to generate strong wage growth, while rising gasoline prices may have inflated revenue at service stations.
US Industrial Production (IP) was lately flat, the US Federal Reserve (Fed) reported, while production was weaker than expected, spurred on by rising costs financing in the manufacturing sector.
Against this background, the US Federal Reserve could continue tightening monetary conditions, and the markets are estimating two additional rate hikes of 25 basis points, which would drag the Federal Funds Rate (FFR) into the 5 range, 0%-5.25%. On Tuesday, a number of Fed policymakers commented that the Fed is not done raising rates, emphasizing what Fed Chairman Powell said that interest rates would stay “higher for longer. “
Therefore, silver prices would remain under pressure as a strong dollar would continue to hurt the prospects for the white metal. With the Federal Reserve set to cut rates through 2024, the white metal could see a rebound once the Fed pauses its tightening cycle. However, a hawkish Fed would bolster the near-term outlook for the dollar.
XAG/USD Technical Analysis
After dipping below the 200 day EMA, XAG/USD could extend its decline towards the November 28 low of $20.87, followed by the November 21 low of $20.59. A break out of those demand zones, and Silver, could head for the $20.00 psychological barrier, followed by the November monthly low at $19.42. Supporting this are oscillators, with the Relative Strength Index (RSI) remaining in bearish territory, while the Rate of Change (RoC) suggests sellers are gathering momentum.
Source: Fx Street
I am Joshua Winder, a senior-level journalist and editor at World Stock Market. I specialize in covering news related to the stock market and economic trends. With more than 8 years of experience in this field, I have become an expert in financial reporting.


