
- The price of Silver persists while caution prevails in the markets regarding the path of the Fed’s interest rates.
- Momentum indicators signal a possible bearish sentiment in the price of Silver.
- The psychological level of $21.50 is emerging as immediate support.
The price of Silver (XAG/USD) continues its bearish trajectory, trading lower around $21.80 during the European session on Monday. Prices of non-yielding assets such as Silver are facing challenges, primarily due to bullish US Treasury yields. The 10-year US Treasury bond yield stands at 4.61%.
Additionally, China released its manufacturing PMI data over the weekend, indicating improvement and entering positive territory. However, this positive development did not seem to have a favorable impact on Silver prices.
China’s August manufacturing PMI rose to 50.2 from 49.7 previously, beating the 50.0 forecast. Additionally, the Non-Manufacturing PMI rose to 51.7 from the previous reading of 51.0, beating the market consensus of 51.5.
The current momentum in XAG/USD appears to have a bearish bias as the 14-day Relative Strength Index (RSI) remains below the 50 level.
XAG/USD could find support at the psychological level of $21.50 and then the level of $21.00.
To the upside, the 23.6% Fibonacci retracement at $22.46 aligned with the 7-day EMA at $22.49.
If it breaks above the latter, XAG/USD could explore the 14-day EMA zone at $22.79, followed by the psychological level of $23.00.
The MACD indicator is providing a weak signal for Silver bulls. The MACD line is located below the center line and the signal line. This setup suggests that there is potentially weak momentum in the XAG/USD price movement.
XAG/USD daily chart
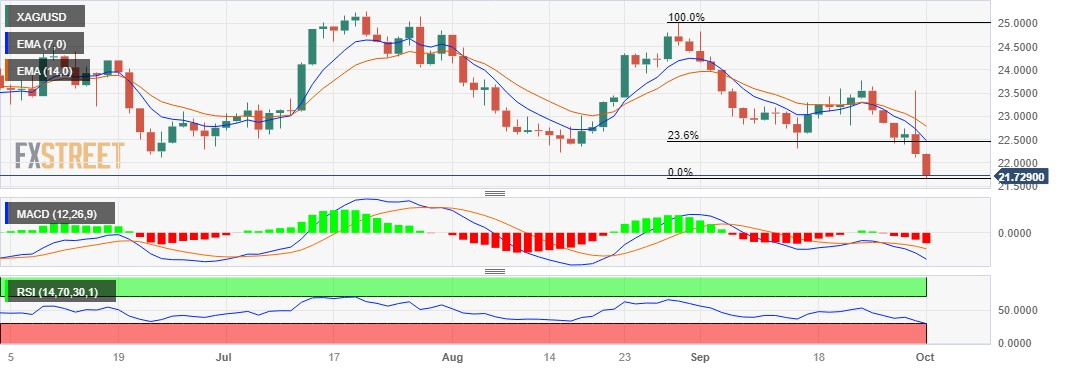
Source: Fx Street
I am Joshua Winder, a senior-level journalist and editor at World Stock Market. I specialize in covering news related to the stock market and economic trends. With more than 8 years of experience in this field, I have become an expert in financial reporting.


