
- Silver falls and the XAG/USD pair is trading around $22.85, down 0.33%.
- XAG/USD remains biased lower after sliding below the 200-day and 50-day moving averages (DMA).
- A break of the 20-day DMA at $22.20 could expose the $22.00 and $20.77 levels.
The prices of the Silver (XAG/USD) fell on Wednesday mid-session in North America as market sentiment turned negative, which usually supports the gray metal. However, a rebound in US Treasury yields and the strength of the US Dollar (USD), limited XAG/USD’s advance towards $24.00. At the time of writing, Silver is trading at $22.85, losing 0.33% on the day.
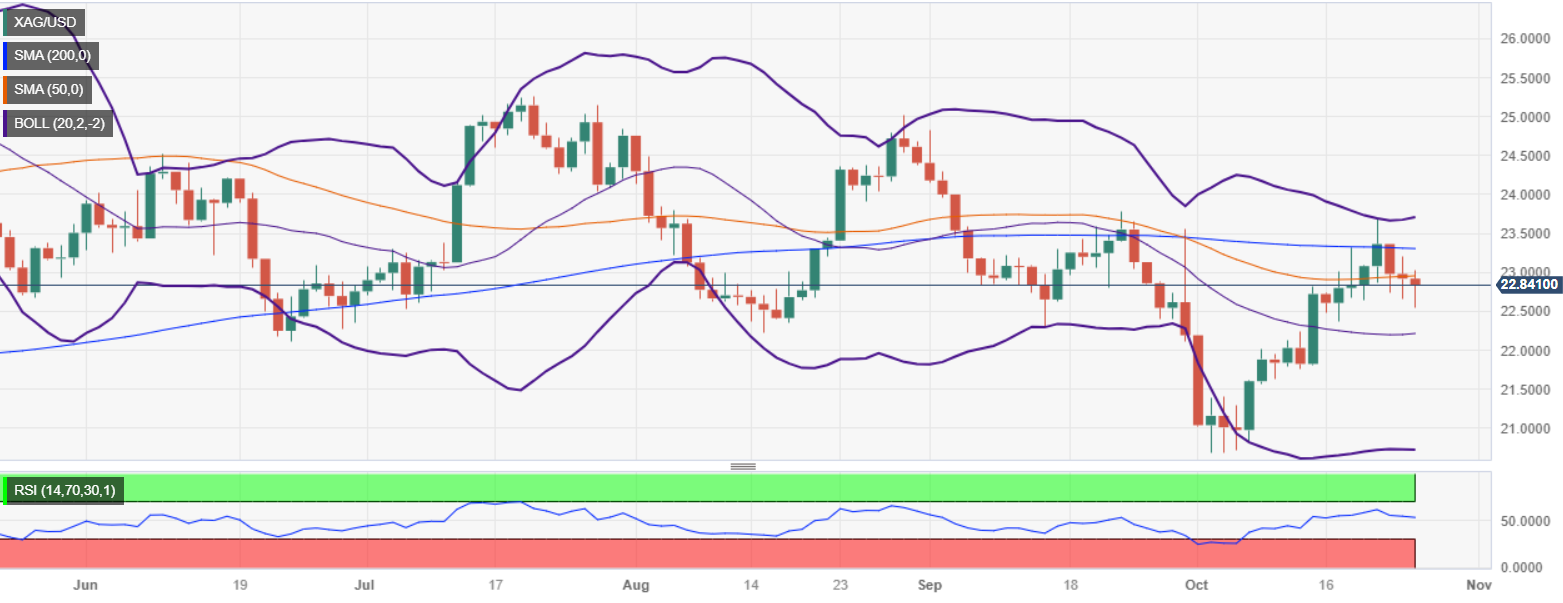
After falling below the 200-day and 50-day moving averages (DMA), XAG/USD remains biased lower, although far from testing the 20-day DMA at $22.20. A break of the latter would expose $22.00, followed by the bottom of the Bollinger Band at $20.77, but first, sellers must recover $21.00.
On the other hand, if
XAG/USD Price Action – Daily Chart
XAG/USD Technical Levels
Source: Fx Street
I am Joshua Winder, a senior-level journalist and editor at World Stock Market. I specialize in covering news related to the stock market and economic trends. With more than 8 years of experience in this field, I have become an expert in financial reporting.

")


