
- The price of Silver continues to decline and retreats from the more than two-month high reached on Friday.
- The technical situation supports the possibility of buying at lower levels.
- A sustained move above a descending trend line is needed to reaffirm the positive trend.
The price of Silver (XAG/USD) extends Friday’s decline from the $24.15 area, its highest level since September 4, and remains under some selling pressure on the first day of a new week. The white metal remains under pressure in the early stages of the European session and is currently trading around the $23.65-$23.60 zone, down almost 0.50% on the day.
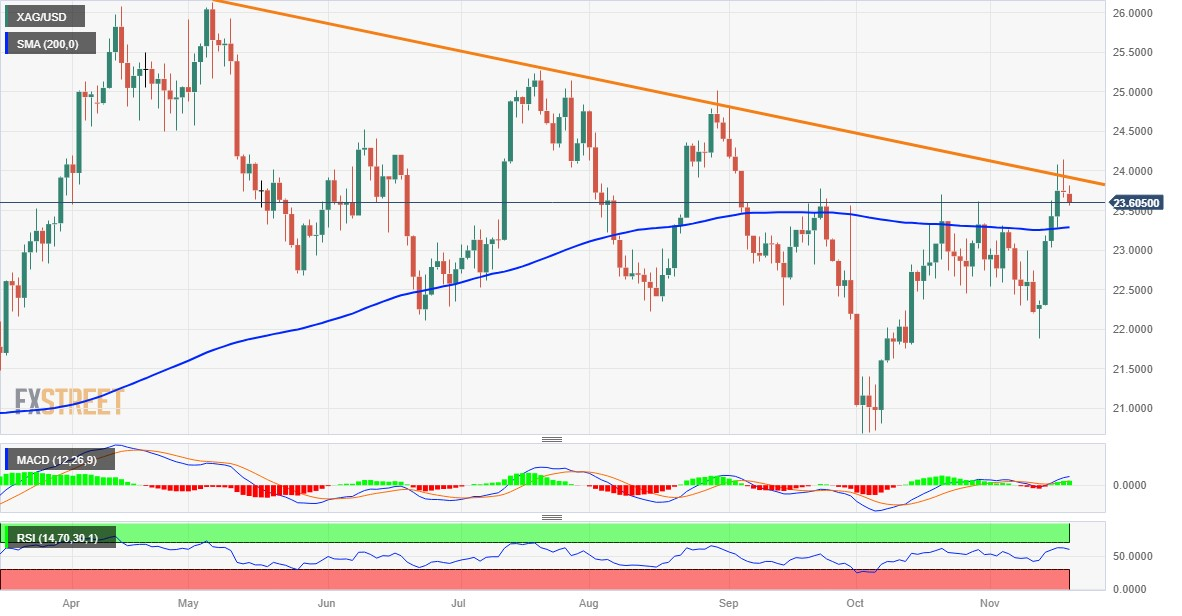
From a technical standpoint, last week’s breakout momentum through the all-important 200-day SMA falters near the resistance of a downtrend line extending from May’s monthly high. This barrier, currently around the round $24-00 level, should now act as a key point for XAG/USD and help determine the next directional move.
Meanwhile, the oscillators on the daily chart remain in positive territory and are still far from being in the overbought zone. This, in turn, suggests that the path of least resistance for XAG/USD is to the upside and supports the prospects of some buying emerging at lower levels. The bulls, however, must wait for acceptance above the $24.00 level before opening new positions and positioning for fresh gains.
XAG/USD could then try to overcome the intermediate resistance of $24.20-$24.25 and make a new attempt to conquer the psychological level of $25.00. Continuation buying above the $25.15-$25.20 area should set the stage for a return to the round $26.00 level for the first time since May.
On the other hand, the 200-day SMA, currently in the $23.30 area, seems to protect the immediate decline. Any further decline could be considered a buying opportunity and remain capped near the $23.00 level. That said, a convincing break below this last level could trigger aggressive technical selling and drag XAG/USD towards the $22.35-$22.30 area en route to the round $22.00 level.
Daily Silver Price Chart
Additional technical levels
Source: Fx Street
I am Joshua Winder, a senior-level journalist and editor at World Stock Market. I specialize in covering news related to the stock market and economic trends. With more than 8 years of experience in this field, I have become an expert in financial reporting.


