
- The price of Silver regains some positive traction on Friday and rises to a new yearly high.
- The technical situation favors the bulls and supports the prospects for additional gains.
- Dips below the $24.50 resistance, now converted into support, are likely to be bought.
The price of Silver (XAG/USD) attracts new buyers after the modest drop of the previous day and maintains its gains near the yearly high, above the psychological barrier of $25.00 during the first part of the European session on Friday .
From a technical point of view, the recent break through the very important 200-day SMA and subsequent strength beyond the $24.50-$24.60 horizontal barrier was considered a new trigger for the bulls. This, in turn, suggests that the path of least resistance for XAG/USD is to the upside. That said, the Relative Strength Index (RSI) on the daily chart is about to enter overbought territory and warrants some caution.
Therefore, it would be prudent to wait for a short-term consolidation or modest pullback before positioning for the next move higher. However, Some continuation buying should pave the way for an extension of the uptrend of more than two weeks.
On the other hand, the $24.80-$24.75 zone seems to protect the immediate decline before the horizontal resistance, now turned support, at $24.50. Any further decline is likely to attract new buyers and remain capped near the $24.15-$24.10 area. However, continued selling below the $24.00 level could turn the trend in favor of the bears and drag XAG/USD back towards the 200-day SMA support, currently near the $23.35 region. -23.30$.
Daily Silver Price Chart
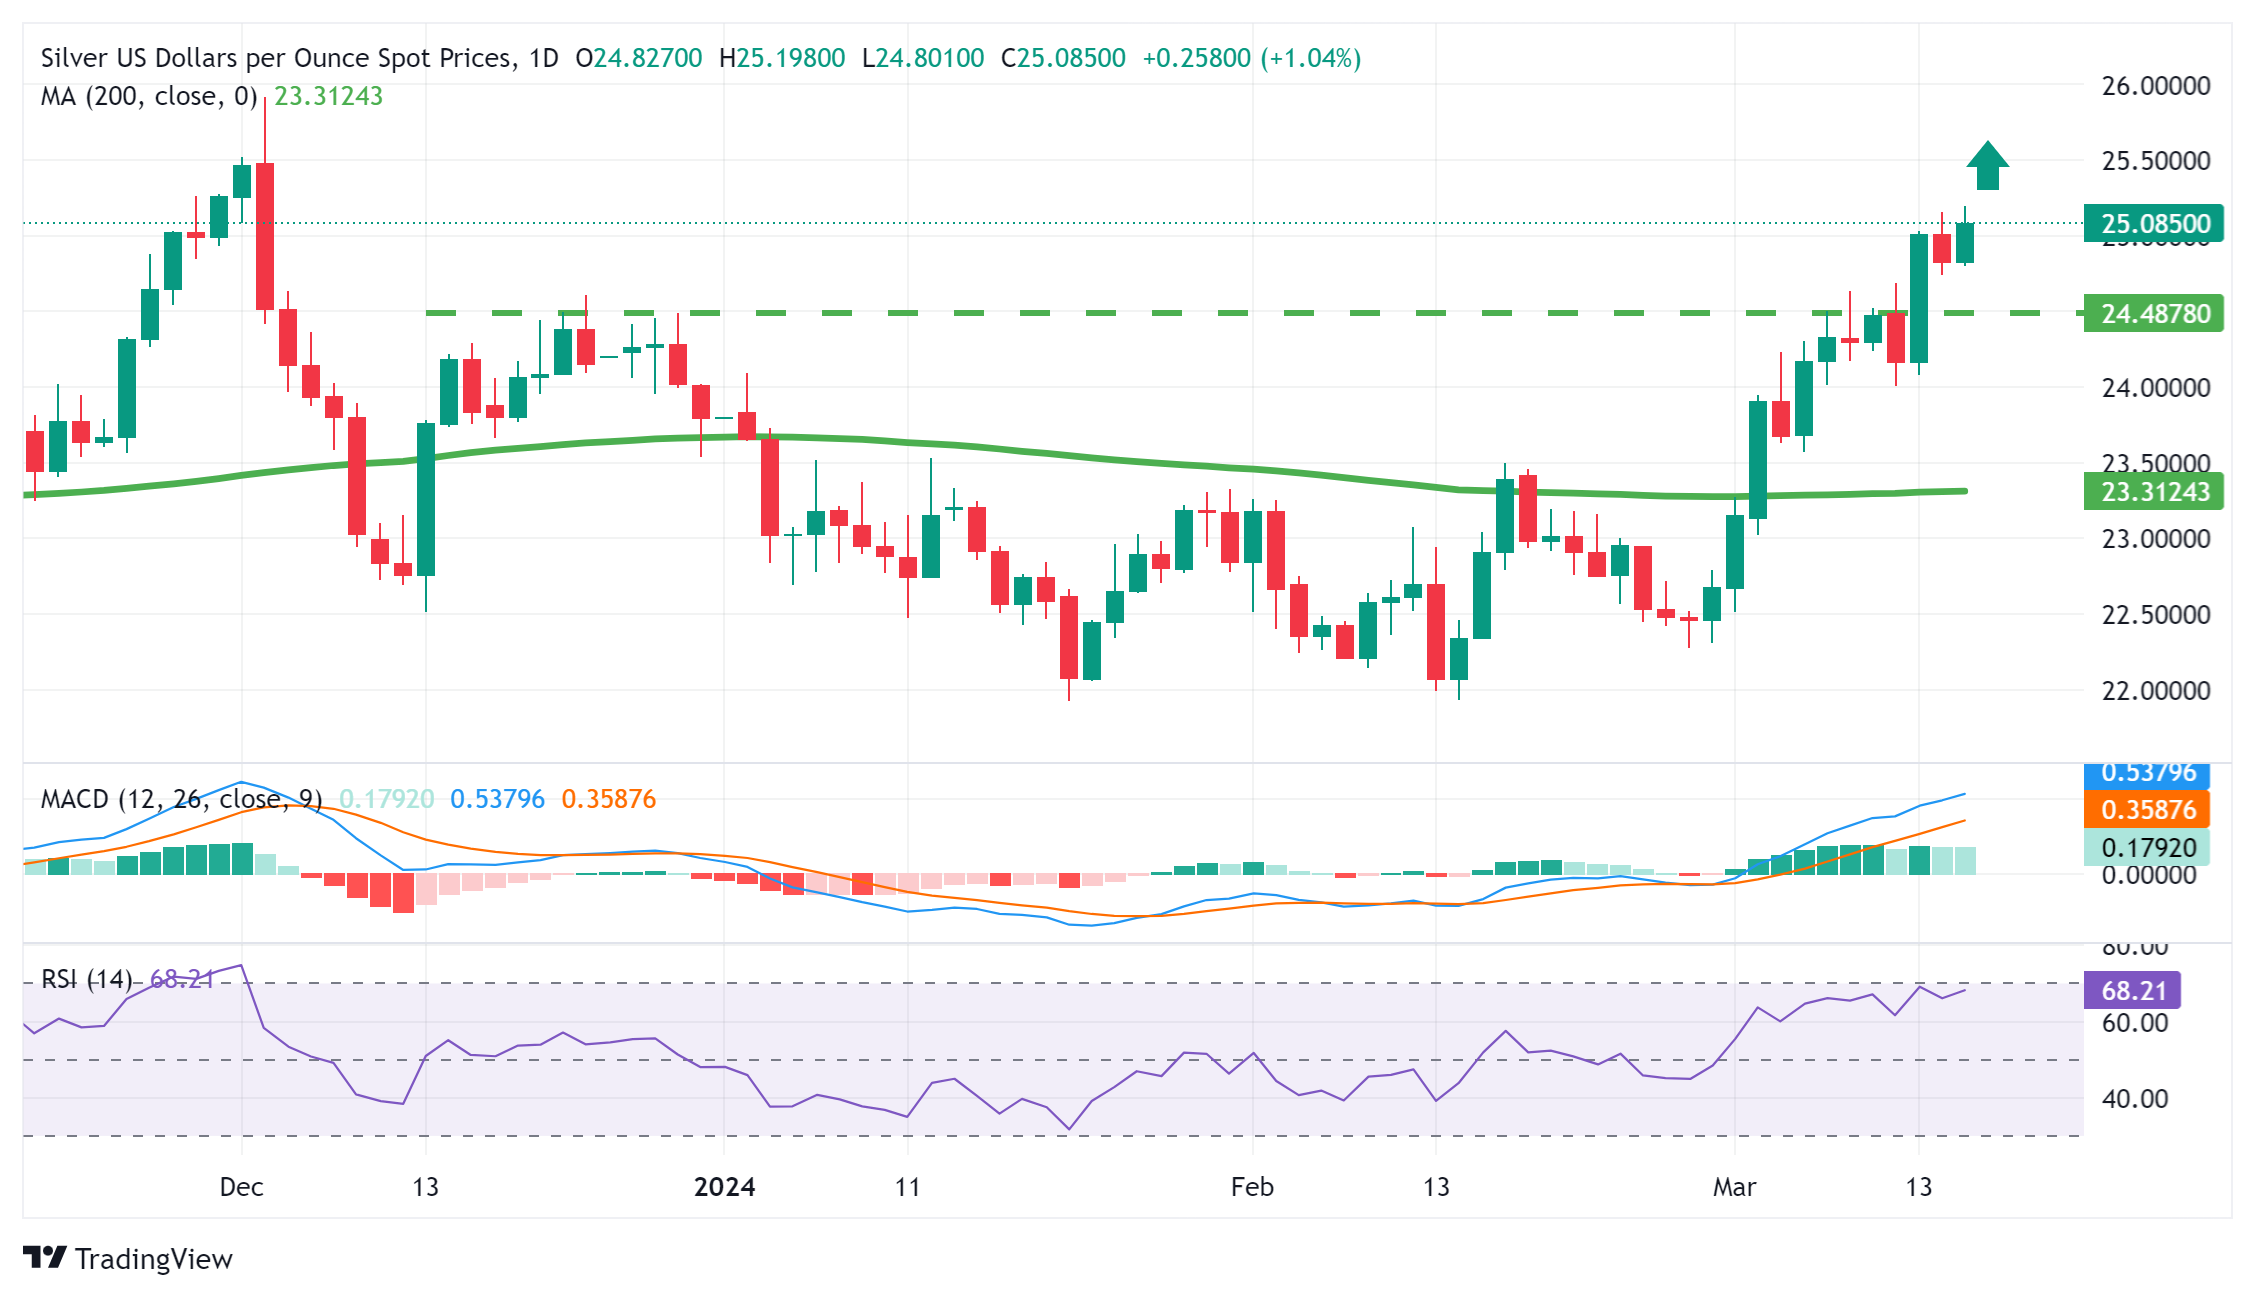
Source: Fx Street
I am Joshua Winder, a senior-level journalist and editor at World Stock Market. I specialize in covering news related to the stock market and economic trends. With more than 8 years of experience in this field, I have become an expert in financial reporting.


