
- The price of Silver rises with a positive bias for the third consecutive day on Thursday.
- The technical scenario advises caution before positioning for further gains.
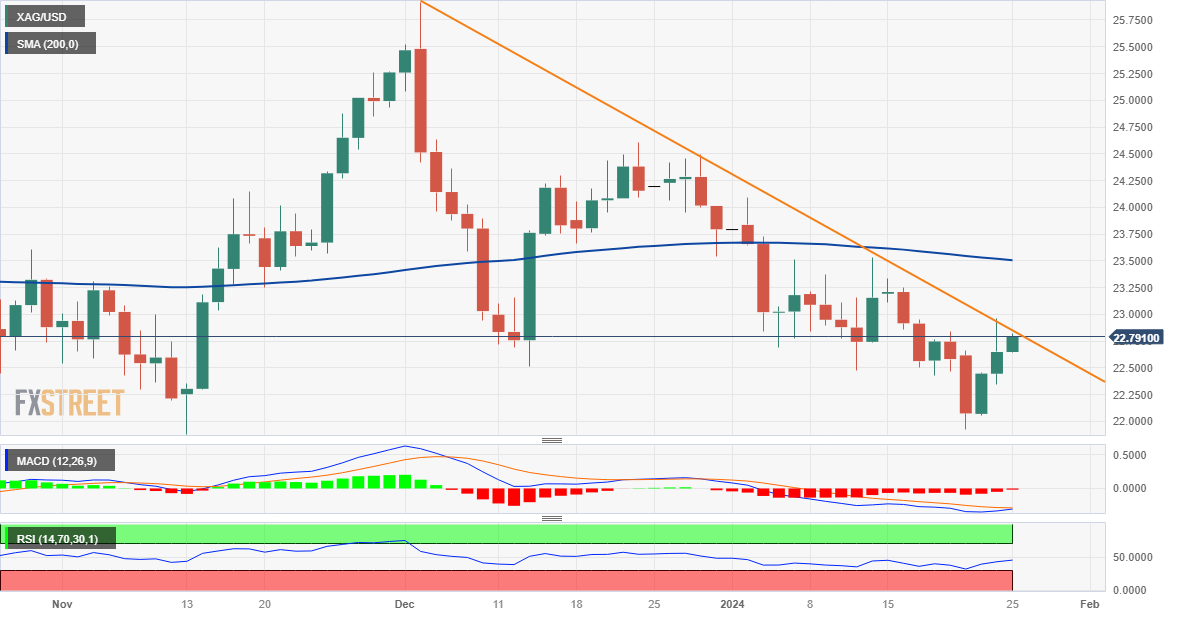
- A convincing break through $23.00 is needed for the bulls to take control.
The price of Silver (XAG/USD) is attracting some buyers for the third day in a row on Thursday and holding on to its modest intraday gains, near the $22.70-$22.75 region during the first half of the European session. The white metal, however, remains below the weekly high, around the round $23.00 level touched the previous day.
The aforementioned zone represents a downtrend resistance line extending from the December high and should act as a key point. Sustained strength above that region could trigger a short-covering rally and lift around $23.50.
Some continuation buying will suggest that XAG/USD has bottomed in the short term and will pave the way for a move towards recovering the round $24.00 level. The momentum could extend further towards the next relevant resistance near the $24.40-$24.50 area. However, on the daily chart, the oscillators are yet to confirm a bullish bias and warrant some caution before positioning for further gains.
On the other hand, the $22.60-$22.55 zone seems to protect the immediate decline, below which XAG/USD could retest a two-month low, around the $21.95-$21.90 region touched on Monday. A convincing break below the latter will be considered a new trigger for the bears and will expose the support at $21.40-$21.35. The subsequent fall could drag the white metal to the $21.00 area, on the way to the October low, around $20.70-$20.65.
Daily Silver Price Chart
Silver additional technical levels
Source: Fx Street
I am Joshua Winder, a senior-level journalist and editor at World Stock Market. I specialize in covering news related to the stock market and economic trends. With more than 8 years of experience in this field, I have become an expert in financial reporting.


