
- Geopolitical tensions are rising as Iran ramps up rhetoric against Israel, causing greater risk aversion.
- Mixed data in the United States: Housing starts increased 7% in September, while construction permits fell 4.4%.
- Despite high inflation in New Zealand, the RBNZ is expected to maintain its current monetary policy…
He New Zealand dollar (NZD) plummeted to a new year-to-date low of 0.5851 against the US dollar (USD) on Wednesday, spurred by risk aversion and a rally in U.S. Treasury yields. Geopolitical tensions support the Dollar to the detriment of high beta currencies, such as the Kiwi (NZD). The NZD/USD pair changes hands around 0.5855, losing 0.69% on the day.
Kiwi faces selling pressure as risk aversion dominates
Market sentiment remains fragile as Wall Street posts losses. US President Biden’s visit to the Middle East has not served to pour cold water on a conflict that could worsen even further, as Iran has intensified its rhetoric against Israel, according to Bloomberg. An explosion at a Gaza hospital revived fears among traders of a possible escalation, as bond yields soared around the world.
On Tuesday, US retail sales and industrial production showed the strength of the economy, although they failed to change the dovish rhetoric of recent US Federal Reserve (Fed) officials, even though inflation almost doubles the Fed’s target. Today, US data has been mixed: September housing construction starts rose 7%, exceeding forecasts, while construction permits fell -4.4 %.
Given the background, a revaluation of an hawkish Fed could be expected. Even so, money market futures have ruled out a 25 basis point hike for November, while December and January remain in place, with a probability for the latter of 51.65%.
On the New Zealand front, the latest Consumer Price Index (CPI) report revealed that inflation remains elevated, suggesting that the Reserve Bank of New Zealand (RBNZ) would maintain its bullish stance for longer. Even though Chinese data on Wednesday showed the economy is growing faster than expected, deteriorating sentiment triggered outflows of risk currencies into safe-haven pairs.
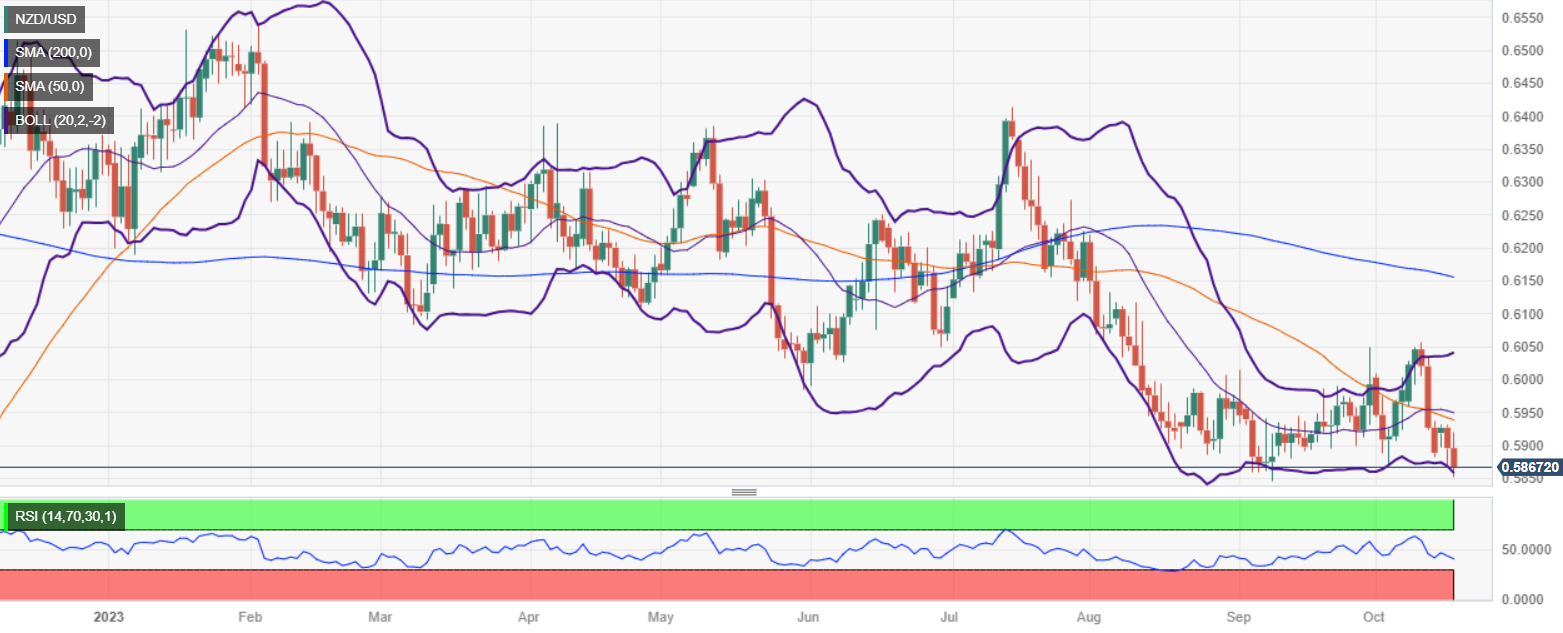
NZD/USD Price Analysis: Technical Outlook
The fall of NZD/USD to a new year-to-date low opened the door to further losses, with first support at last year’s November 22 swing low at 0.5840. A break of the latter would expose the daily low of November 3 at 0.5740, followed by the swing low of October 21, 2022 at 0.5599. On the other hand, if NZD/USD holds above 0.5900, buyers would hope to reach the 50-day moving average (DMA) at 0.5937.
Source: Fx Street
I am Joshua Winder, a senior-level journalist and editor at World Stock Market. I specialize in covering news related to the stock market and economic trends. With more than 8 years of experience in this field, I have become an expert in financial reporting.


