
- NZD/USD extends losses to psychological support at 0.6100 on Friday.
- Technical analysis suggests bearish momentum to revisit the March low at 0.6068.
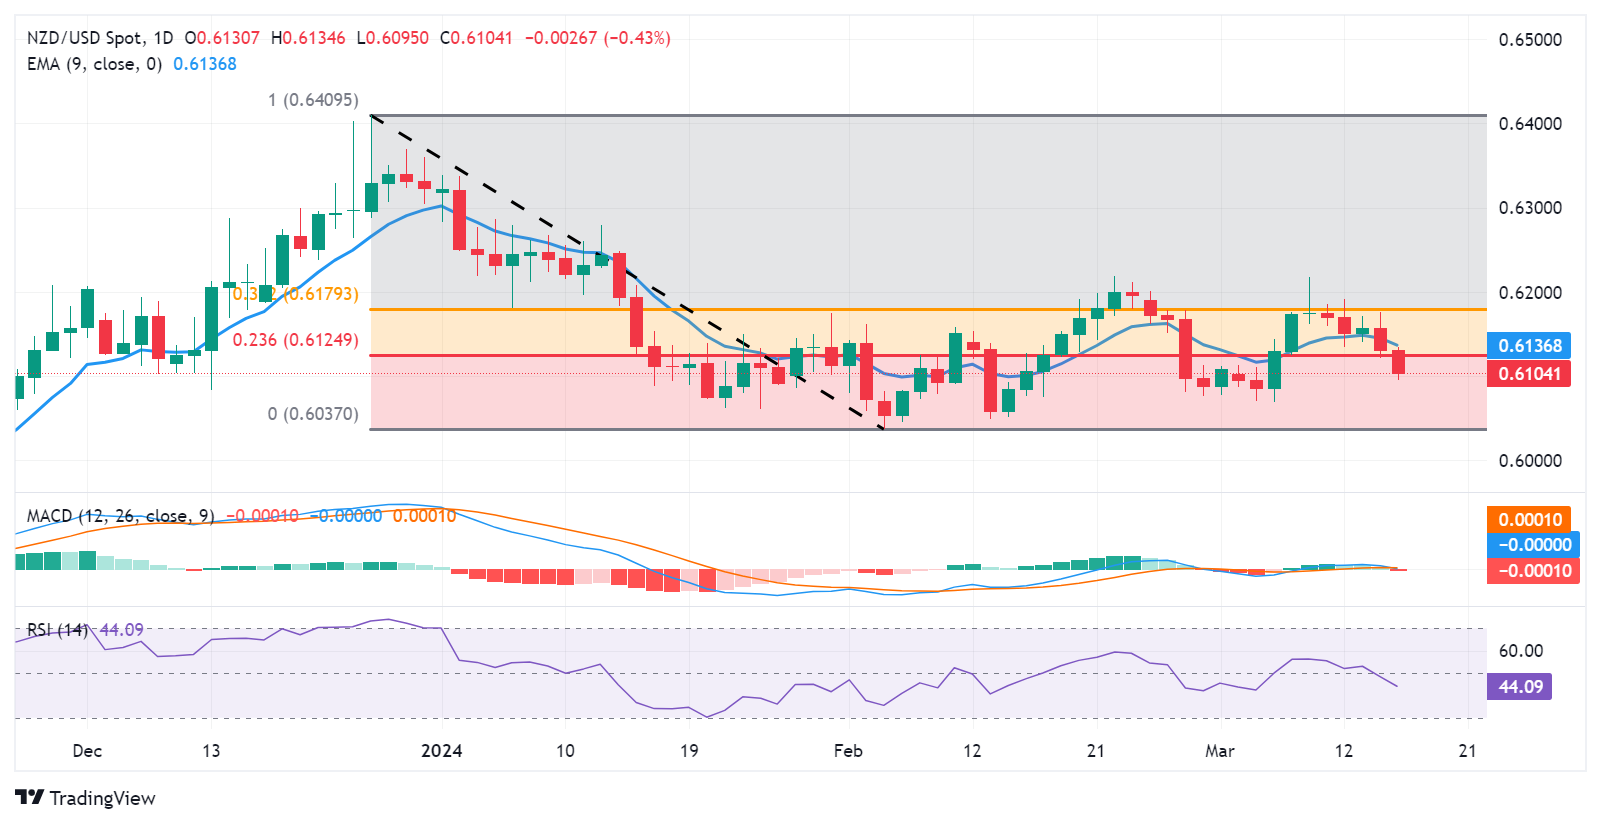
- The key resistance zone appears around the 23.6% Fibonacci retracement at 0.6124 and the 9-day EMA at 0.6137.
NZD/USD moves lower, extending its losses near psychological support at 0.6100 at the start of the European session on Friday. A decisive move below this level could put bearish pressure on the pair to navigate the zone around the March low at 0.6068 and important support at the 0.6050 level.
A break below this latest level could lead the NZD/USD pair to revisit the February low at 0.6037, followed by psychological support at 0.6000. Investors will closely monitor these levels for possible changes in market sentiment.
According to the MACD indicator, a bearish sentiment prevails in the NZD/USD pair. The MACD line is situated below both the center line and the signal line, indicating a bearish trend. Furthermore, the 14-day Relative Strength Index (RSI) is below the 50 level, further confirming the bearish sentiment.
To the upside, the NZD/USD pair could find a key barrier at the 23.6% Fibonacci retracement at 0.6124, followed by the 9-day EMA at 0.6137. The pair could face new resistance barriers if it rises further, with key levels expected at 0.6150, followed by the 38.2% Fibonacci retracement at 0.6179.
NZD/USD daily chart
Source: Fx Street
I am Joshua Winder, a senior-level journalist and editor at World Stock Market. I specialize in covering news related to the stock market and economic trends. With more than 8 years of experience in this field, I have become an expert in financial reporting.


; cameras caught the crime")


