
- NZD/USD gains ground as the market discounts the possibility of a rate hike by the Fed.
- Technical indicators suggest bullish sentiment to revisit the three-month high aligned with the psychological level of 0.6100.
- A decisive break below 0.6050 could take the pair towards the 23.6% Fibonacci retracement level.
NZD/USD rebounds as markets discount the likelihood of the Fed raising interest rates further. The NZD/USD pair trades higher around 0.6060 during the European session on Thursday.
Market participants seem to rule out the possibility of a new rate hike by the Fed. This development begins a new downward trend in US Treasury bond yields. This, coupled with the stability of equity markets, undermines the appeal of the US dollar (USD) as a safe haven currency.
The 14-day Relative Strength Index (RSI) is above the 50 level, indicating bullish sentiment for the NZD/USD pair. This could encourage the pair’s bulls to revisit the three-month high at 0.6086 followed by the psychological level of 0.6100.
Furthermore, the MACD line, situated above the center line and diverging above the signal line, is a confirmation of the bullish momentum in the market.
On the downside, a break below the main support level of 0.6050 could push the pair down to the 23.6% Fibonacci retracement at 0.6010, which could serve as a crucial support level aligned with the exponential moving average (EMA). 9 days at 0.6007.
A decisive break below the 9-day EMA could pave the way for the NZD/USD pair to test the 38.2% Fibonacci retracement at 0.5964, aligned with the psychological support region at the 0.5950 level.
NZD/USD daily chart
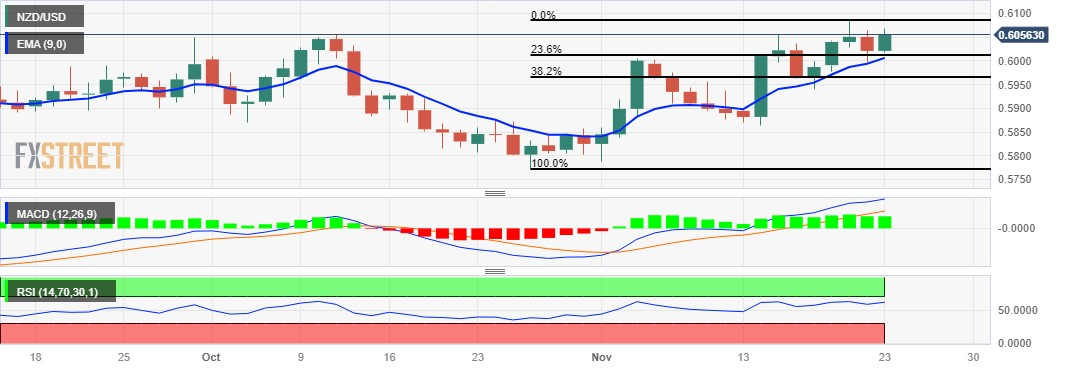
Source: Fx Street
I am Joshua Winder, a senior-level journalist and editor at World Stock Market. I specialize in covering news related to the stock market and economic trends. With more than 8 years of experience in this field, I have become an expert in financial reporting.


