
- The NZD/USD pair hits new lows after breaking out of the bottom of a multi-month range.
- The pair is now oversold and could correct again in the short term.
- Over time, NZD/USD is likely to continue its decline towards bearish price targets.
NZD/USD has broken the bottom of a long-term range and, despite reaching oversold extremes, is likely to decline further.
NZD/USD has been oscillating within a multi-month range from a bottom around 0.6080 to a top around 0.6210. On Tuesday it decisively broke below the floor and took a step lower – a bearish signal for the price.
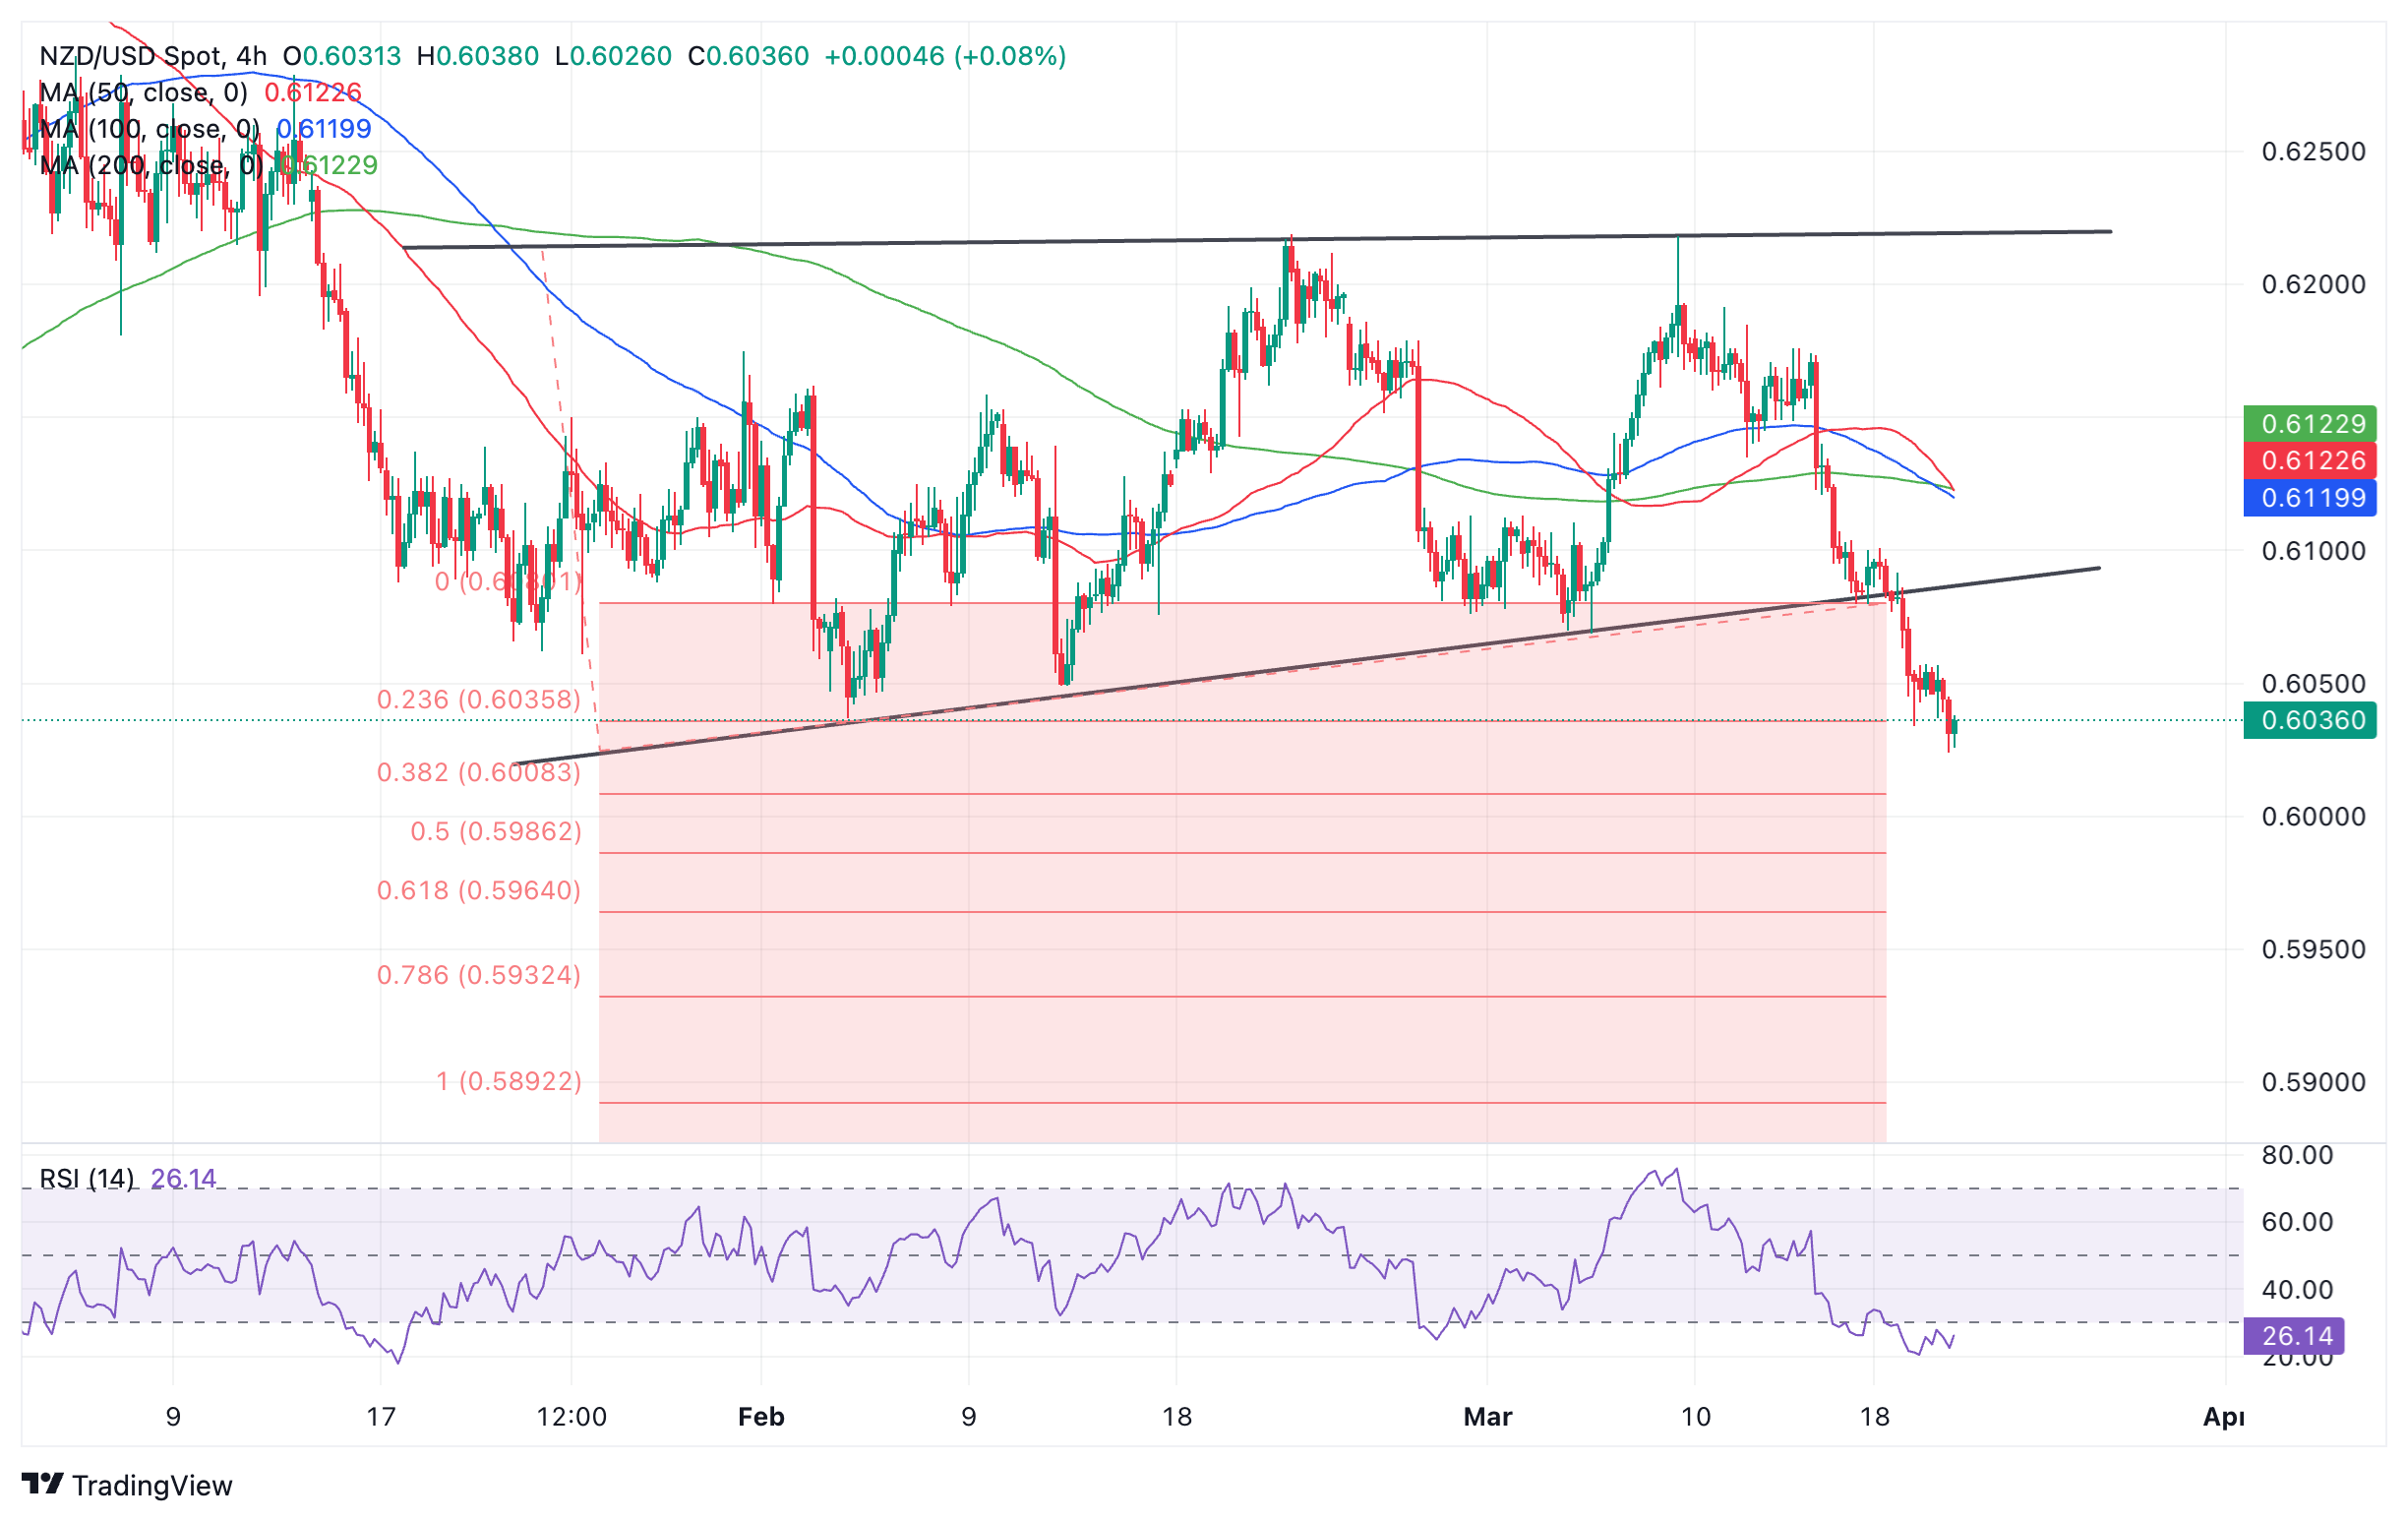
New Zealand Dollar vs US Dollar – 4-Hour Chart
The NZD/USD pair is currently trading around 0.6035 and at oversold extremes according to the RSI (Relative Strength Index) momentum indicator. This indicates that there is a chance for the pair to retrace higher. Traders are advised not to add more short positions while the RSI is oversold and close short positions when the indicator breaks out of oversold.
Despite warning signs of a correction, the long-term outlook remains bearish. The pair is in an established short-term downtrend, with progressively lower highs and lows in the price action, and given the old adage that “the trend is your friend”, this suggests that further falls.
Furthermore, NZD/USD has broken out of a long-term range and, according to technical analysis theory, the height of the range can be used as a guide to how much further the pair could go. In the case of NZD/USD, this suggests that more declines are ahead.
The 0.618 Fibonacci ratio of the range height extrapolated from the breakout point to the downside provides an initial target at 0.5964. The 1.000 ratio provides an additional target at 0.5892.
Source: Fx Street
I am Joshua Winder, a senior-level journalist and editor at World Stock Market. I specialize in covering news related to the stock market and economic trends. With more than 8 years of experience in this field, I have become an expert in financial reporting.


![News and prognosis of the price of the pound sterling: GBP/USD shoots above 1,3400 [Video]](https://editorial.fxsstatic.com/images/i/GBPUSD_Large.png "News and prognosis of the price of the pound sterling: GBP/USD shoots above 1,3400 [Video]")


