
- The NZD/USD pair rallied after the decline in the US CPI, despite the fact that the core CPI remained unchanged.
- The FOMC minutes showed that the US banking crisis put a pause in the tightening cycle on the table.
- NZD/USD Price Analysis: The upside could be capped by the daily EMAs, but once broken it can rally as far as 0.6300.
NZD/USD did a 180 degree turn higher after the latest FOMC Minutes preliminarily indicated that Fed officials were considering a pause in their tightening campaign. Also, mixed US inflation numbers keep investors tilted towards a riskier asset, as evidenced by Wall Street poised to end with minimal gains. At the time of writing, the NZD/USD pair is trading at 0.6217.
The FOMC gave mixed signals, about a pause and a bigger hike
During the recent Federal Reserve policy meeting, officials discussed the possibility of keeping rates unchanged after the failure of two regional banks. This decision was motivated by the concern that a greater adjustment could cause financial tensions. Despite this, participants agreed that the Fed’s actions had helped alleviate concerns in the banking sector. These measures were similar to those taken by the Bank of England following the bond turmoil stemming from former Prime Minister Liz Truss’s mini-budget. Against this background, the last Fed meeting supported a 25 basis point rate hike.
Participants commented that inflation remains above the 2% target and that inflationary pressures were “declining fast enough to bring inflation back to 2% over time.” Some Fed members said they considered a 50-point increase. basics if there was no banking crisis. Furthermore, Fed officials noted “inflation was still too high and the labor market was still too tight.”
Earlier, a report on US inflation revealed that the headline CPI fell from 6% in February to 5% annually. However, core inflation, which excludes food and energy, remained unchanged at 5.6% yoy.
NZD/USD Technical Analysis
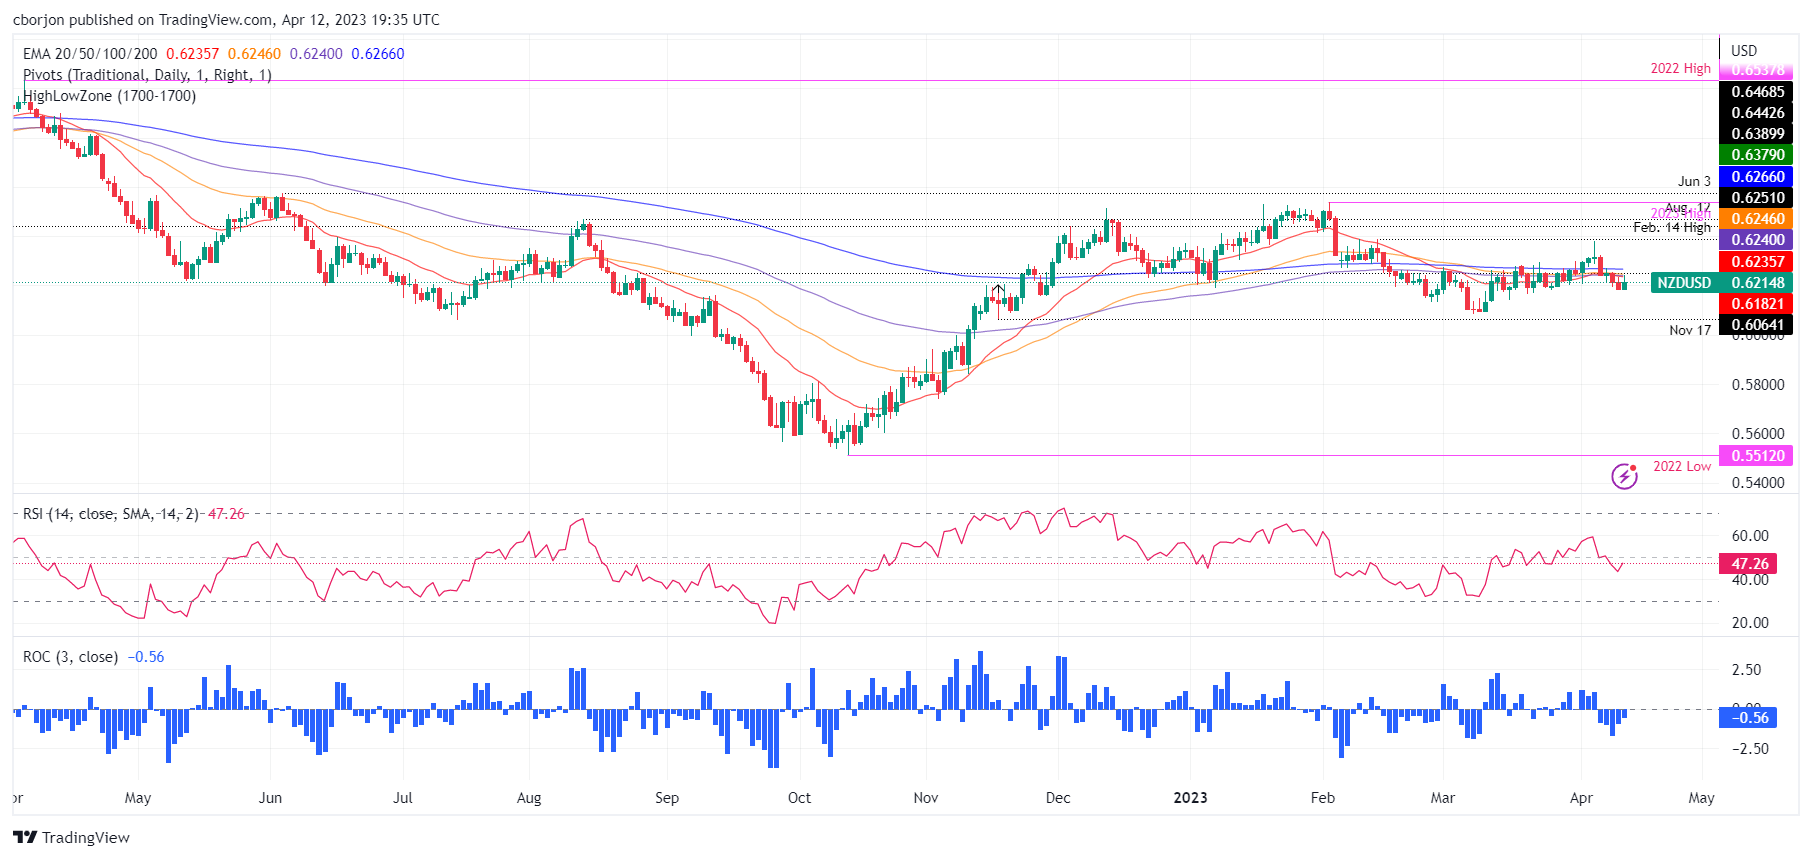
The NZD/USD pair has broken two days of consecutive losses and is forming a bullish engulfing candlestick pattern. Although the pattern suggests further gains are in store, the NZD/USD needs to clear a crowded resistance zone, with the 20, 100, and 50 day EMAs at 0.6235, 0.6240, and 0.6246, respectively. Once this zone is broken, NZD/USD could rally towards the February 14 high of 0.6389.
Source: Fx Street
I am Joshua Winder, a senior-level journalist and editor at World Stock Market. I specialize in covering news related to the stock market and economic trends. With more than 8 years of experience in this field, I have become an expert in financial reporting.


