
- NZD/JPY has been trading sideways recently, without showing a clear trend.
- Technical indicators suggest growing bearish momentum, with the RSI and MACD starting to favor sellers.
- The 100 and 200 day SMA completed a bearish crossover at 92.00.
The NZD/JPY pair has traded within a tight range recently, demonstrating a lack of clear directional momentum. However, Friday’s session saw a modest 0.32% drop to 91.00, suggesting a possible change in sentiment.
Technical indicators align with this observation. The Relative Strength Index (RSI) of 52 suggests that buying pressure is easing. Meanwhile, the Moving Average Convergence/Divergence Indicator (MACD) histogram is in the red and rising, indicating growing bearish momentum. This divergence between price action and technical indicators suggests that selling forces may be gaining ground.
It is important to note that the 100-day and 200-day Simple Moving Averages (SMA) have converged and crossed at 92.00, forming a strong resistance level. A break below this confluence could intensify selling pressure and add more bearish momentum to the pair. Conversely, a break above this key level could signal a reversal of the current trend.
NZD/JPY daily chart
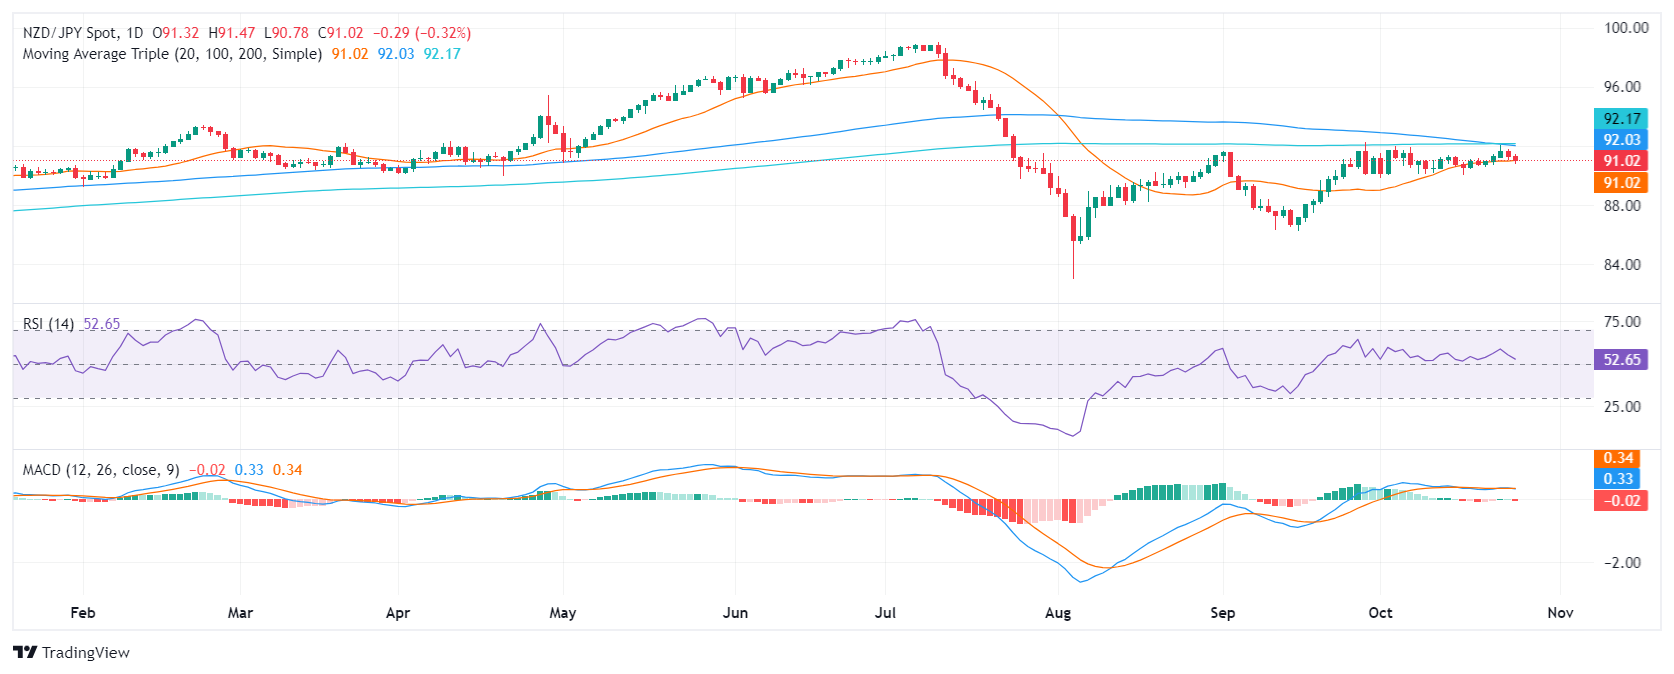
Source: Fx Street
I am Joshua Winder, a senior-level journalist and editor at World Stock Market. I specialize in covering news related to the stock market and economic trends. With more than 8 years of experience in this field, I have become an expert in financial reporting.


