
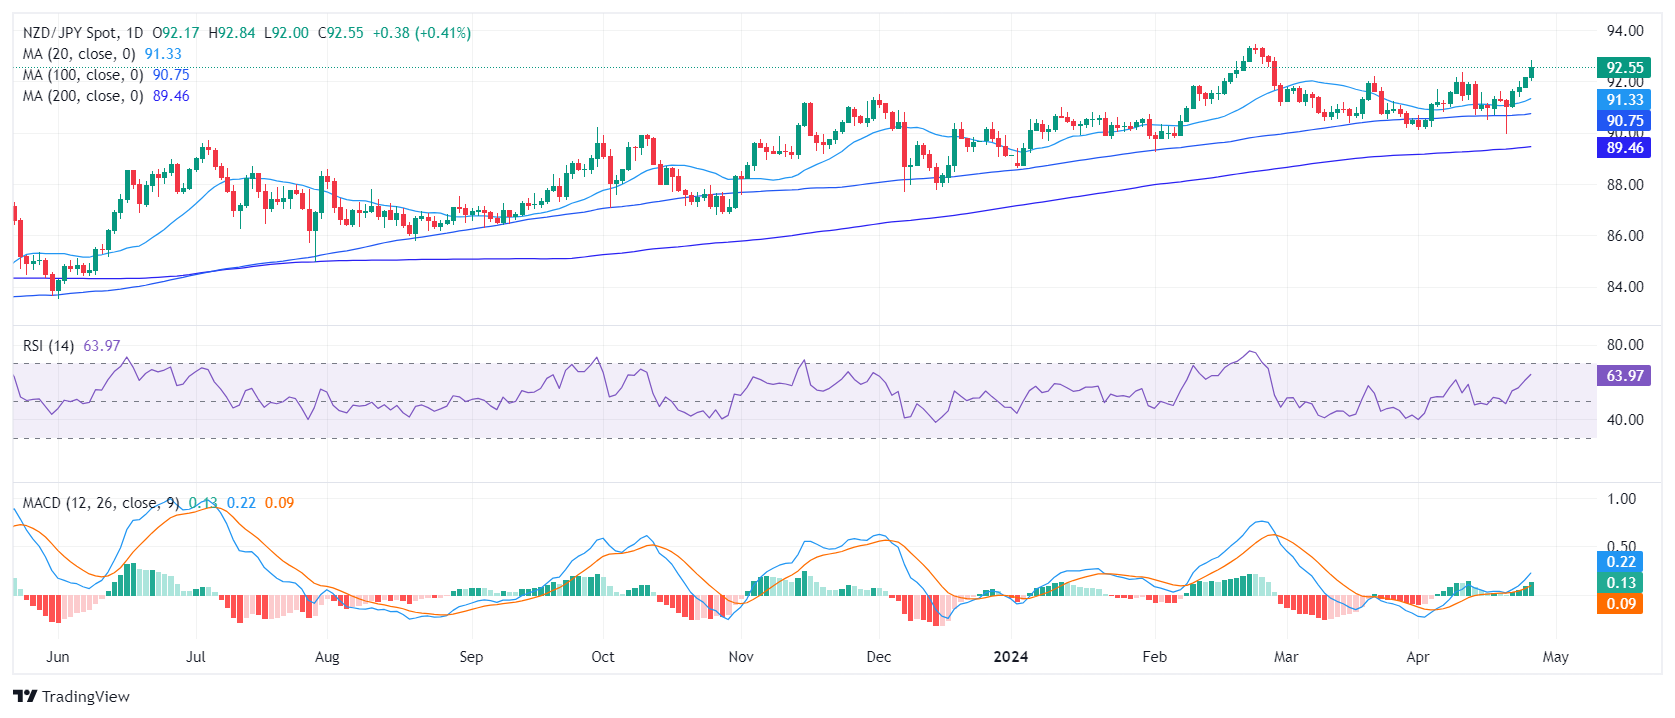
- The daily RSI shows strong buying momentum for NZD/JPY, moving deep into positive territory.
- In parallel, the daily MACD shows green bars in an uptrend, suggesting growing buying traction.
- A potential market correction could be imminent as the daily RSI reaches near overbought conditions.
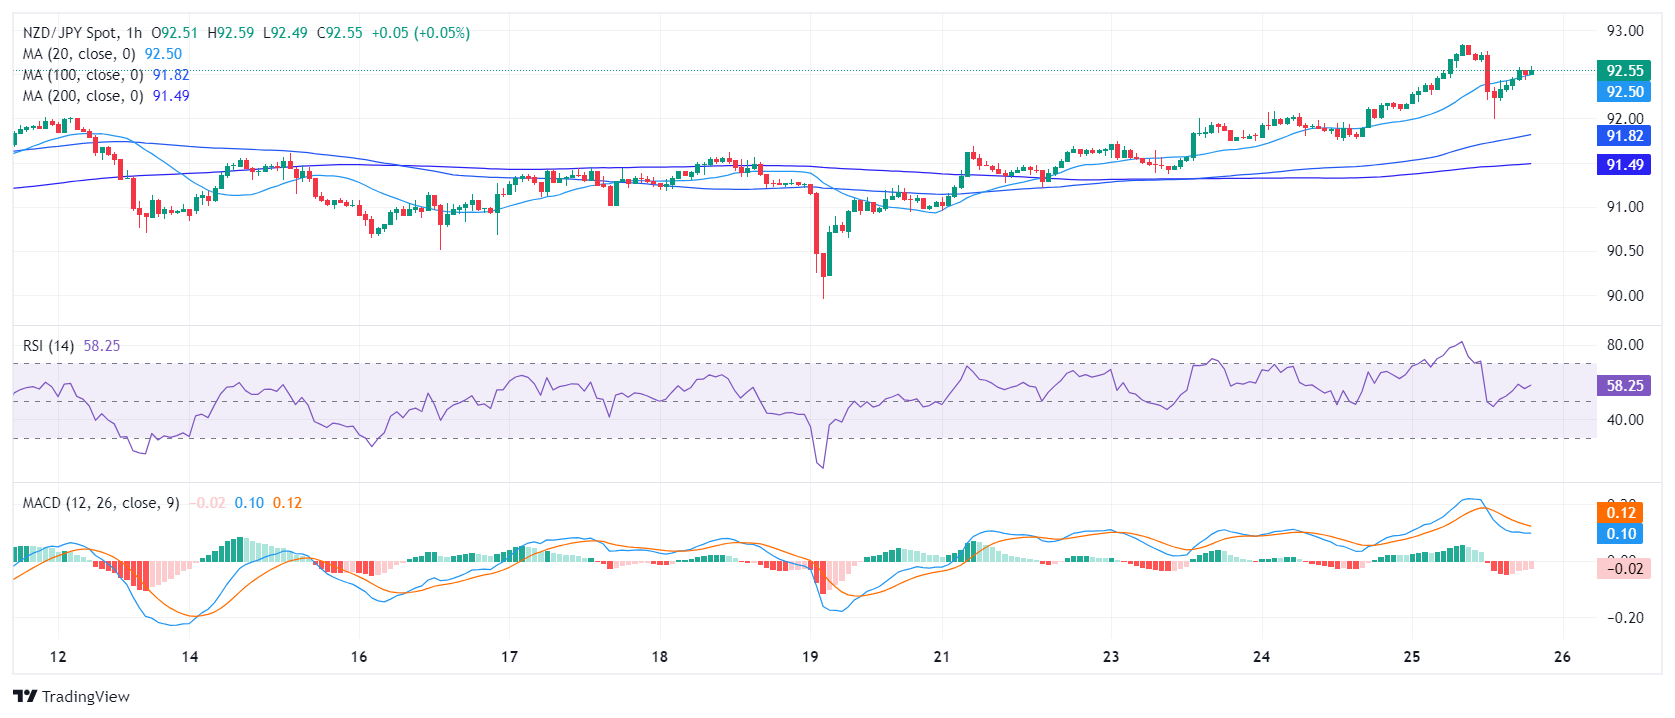
- A slight decline in the hourly indicators signals a buying pause, at least for Thursday's session.
The NZD/JPY pair has shown bullish behavior, supported by strong buying momentum during recent sessions. Although it stands at 92.55, the highest since February, signs of a possible market turn are emerging, as indicators approach the overbought zone.
According to the daily chart, the RSI indicates increasing bullish momentum, having moved from negative territory to positive conditions during the previous session and is standing near the 70 threshold. At the same time, the moving average convergence divergence (MACD) shows rising green bars, indicating positive momentum developing. However, the RSI is approaching overbought conditions, warning us of the possibility of a market correction.
NZD/JPY daily chart
On the hourly chart, the RSI advanced from a negative trend to a positive one. However, the recent RSI levels are slightly lower as they appear to be correcting the overbought conditions seen earlier in the session.
NZD/JPY hourly chart
 In a broader context, NZD/JPY's placement relative to its simple moving average (SMA), the cross pair is trading above its 20-, 100-, and 200-day SMAs, suggesting a bullish trajectory. This positioning supports both short-term buying opportunities and favorable long-term prospects, affirming a sustained long-term bullish trend for NZD/JPY.
Source: Fx Street
I am Joshua Winder, a senior-level journalist and editor at World Stock Market. I specialize in covering news related to the stock market and economic trends. With more than 8 years of experience in this field, I have become an expert in financial reporting.


")


