
- The NZD/JPY pair settled at 91.12, with slight losses in Friday's session.
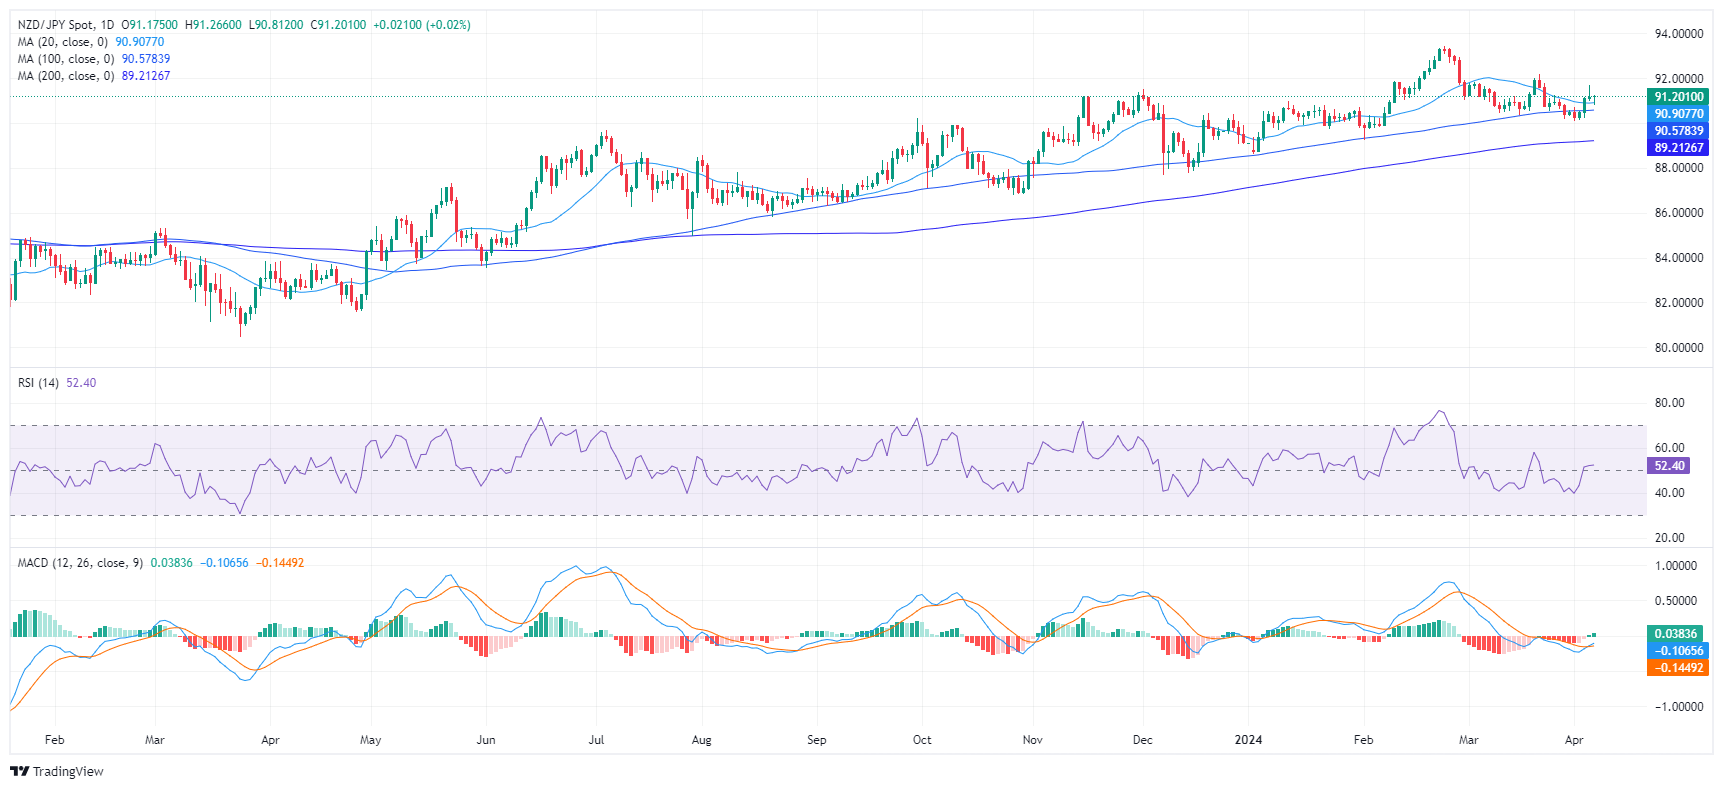
- The daily RSI shows a stable uptrend.
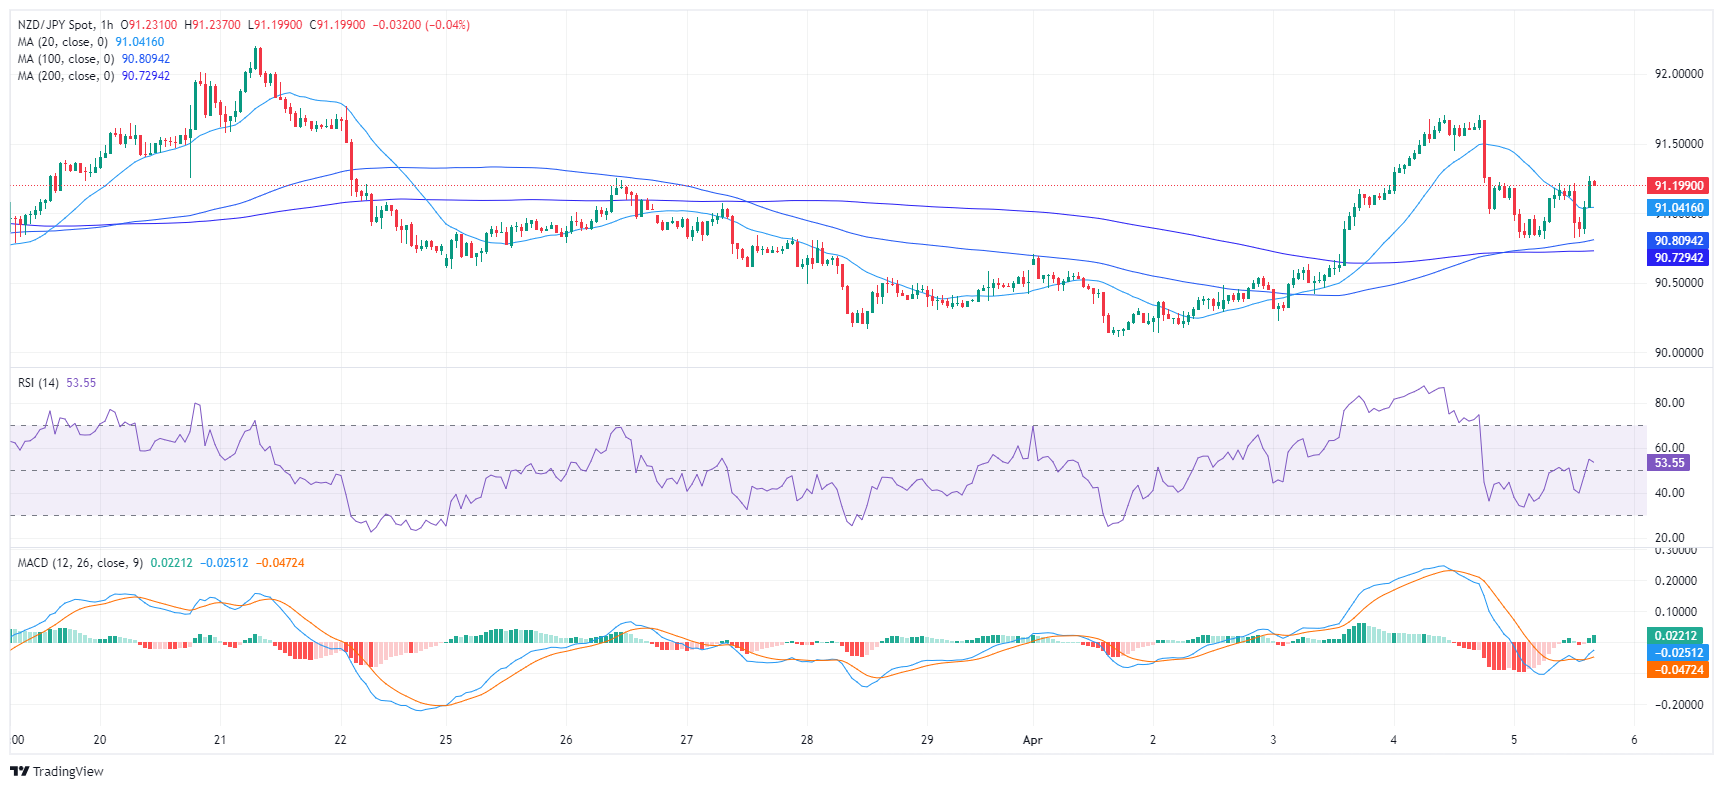
- The hourly chart shows bullish sentiment despite some variability.
The NZD/JPY pair, with a slight decline, is currently trading at 91.12 in the Friday session. On the daily chart, the bullish momentum remains strong, while buyers are more present on the hourly time frames.
On the daily chart, the Relative Strength Index (RSI) for the pair is showing a broadly favorable trend, with a recent rise from the negative zone into positive territory. Meanwhile, the moving average convergence divergence (MACD) is producing green bars, indicating positive upward momentum.
NZD/JPY daily chart
A similar pattern is observed in the RSI values on the hourly chart. Despite some variability, in recent hours, the RSI remains in the positive sector, making the momentum primarily bullish. The MACD supports this bullish tilt as it illustrates ascending green bars, implying an intensifying bullish momentum on the hourly chart.
NZD/JPY hourly chart
Looking at the overall trend, NZD/JPY is above its 20,100-day and 200-day SMA, indicating a long-term bullish stance.
In summary, based on the daily and hourly RSI indicators, along with the green MACD bars, momentum favors buyers. However, some flattening was observed in the daily indicators, but as long as the pair remains above its main SMAs, the outlook will be positive.
Source: Fx Street
I am Joshua Winder, a senior-level journalist and editor at World Stock Market. I specialize in covering news related to the stock market and economic trends. With more than 8 years of experience in this field, I have become an expert in financial reporting.


