
- Daily technical analysis reveals continued bearish momentum but with indicators recovering.
- On the hourly chart, bullish signals are observed with the RSI in positive territory.
- Despite short-term bearish indicators, the pair is trading above the main SMAs, indicating persistent bullish sentiment in the overall trend.
During the session on Tuesday, the NZD/JPY pair reached the 91.05 area, registering a slight increase of 0.15%. Currently, the market is mainly under the control of sellers, resulting in a short-term bearish outlook. However, the overall picture remains bullish, indicating the possibility of buyers regaining control in the coming sessions.
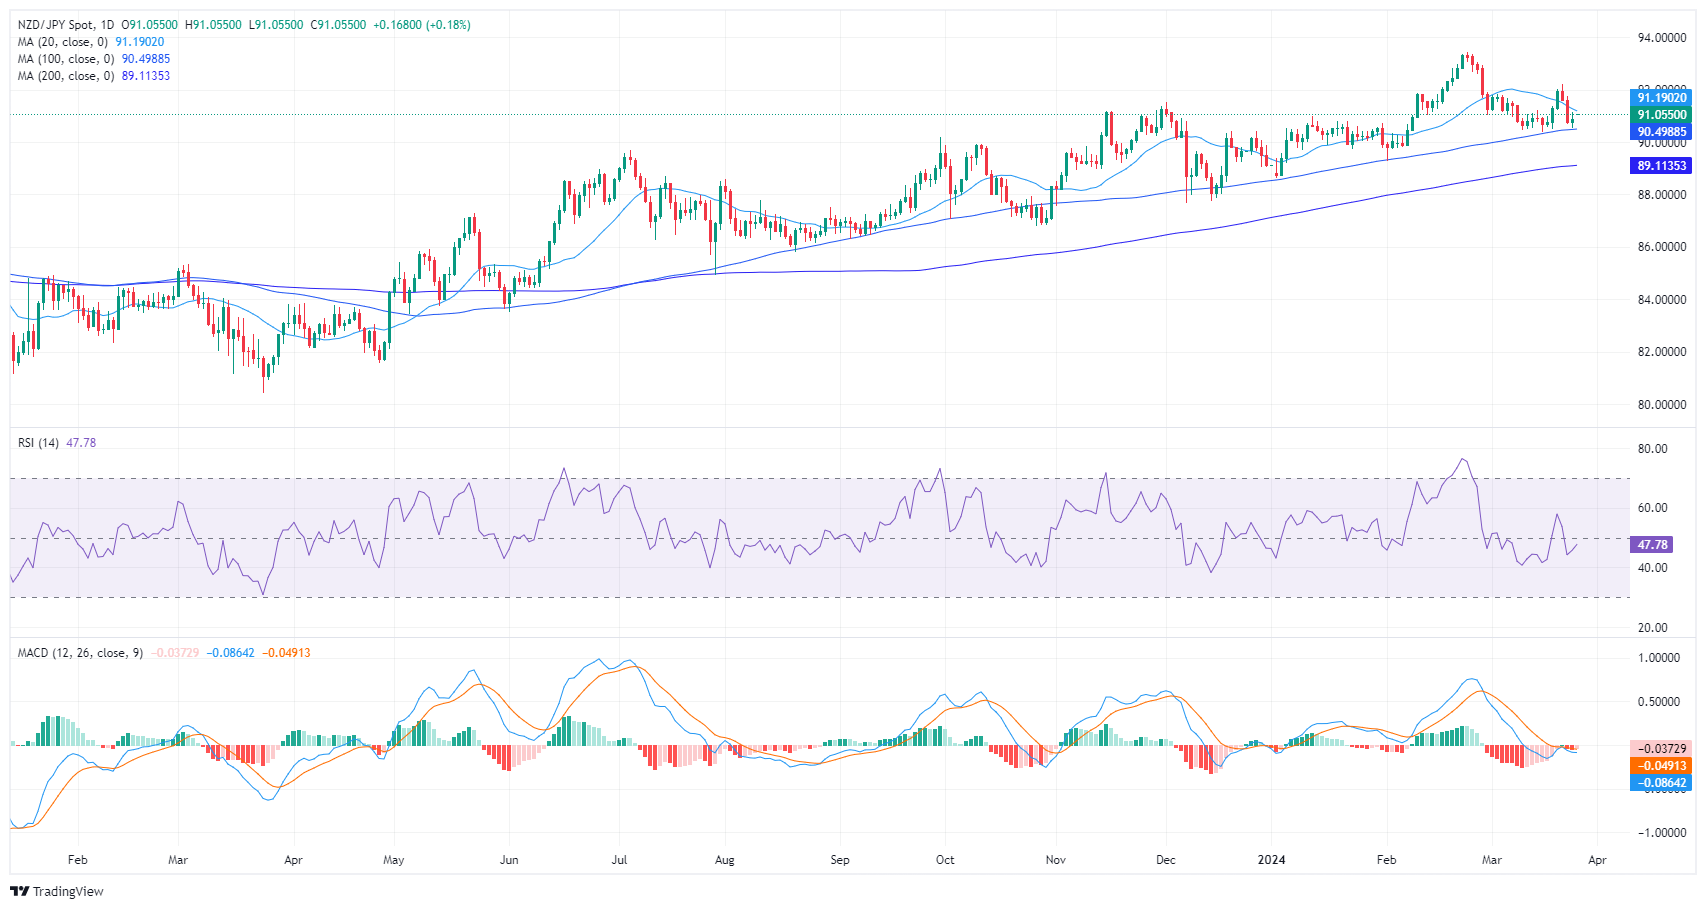
On the daily chart, the NZD/JPY pair has been demonstrating bearish momentum, as suggested by the Relative Strength Index (RSI) readings. The RSI, which was in positive territory last week, dipped into the negative zone, marking a progressive decline with a rebound printed in Tuesday's session.
NZD/JPY daily chart
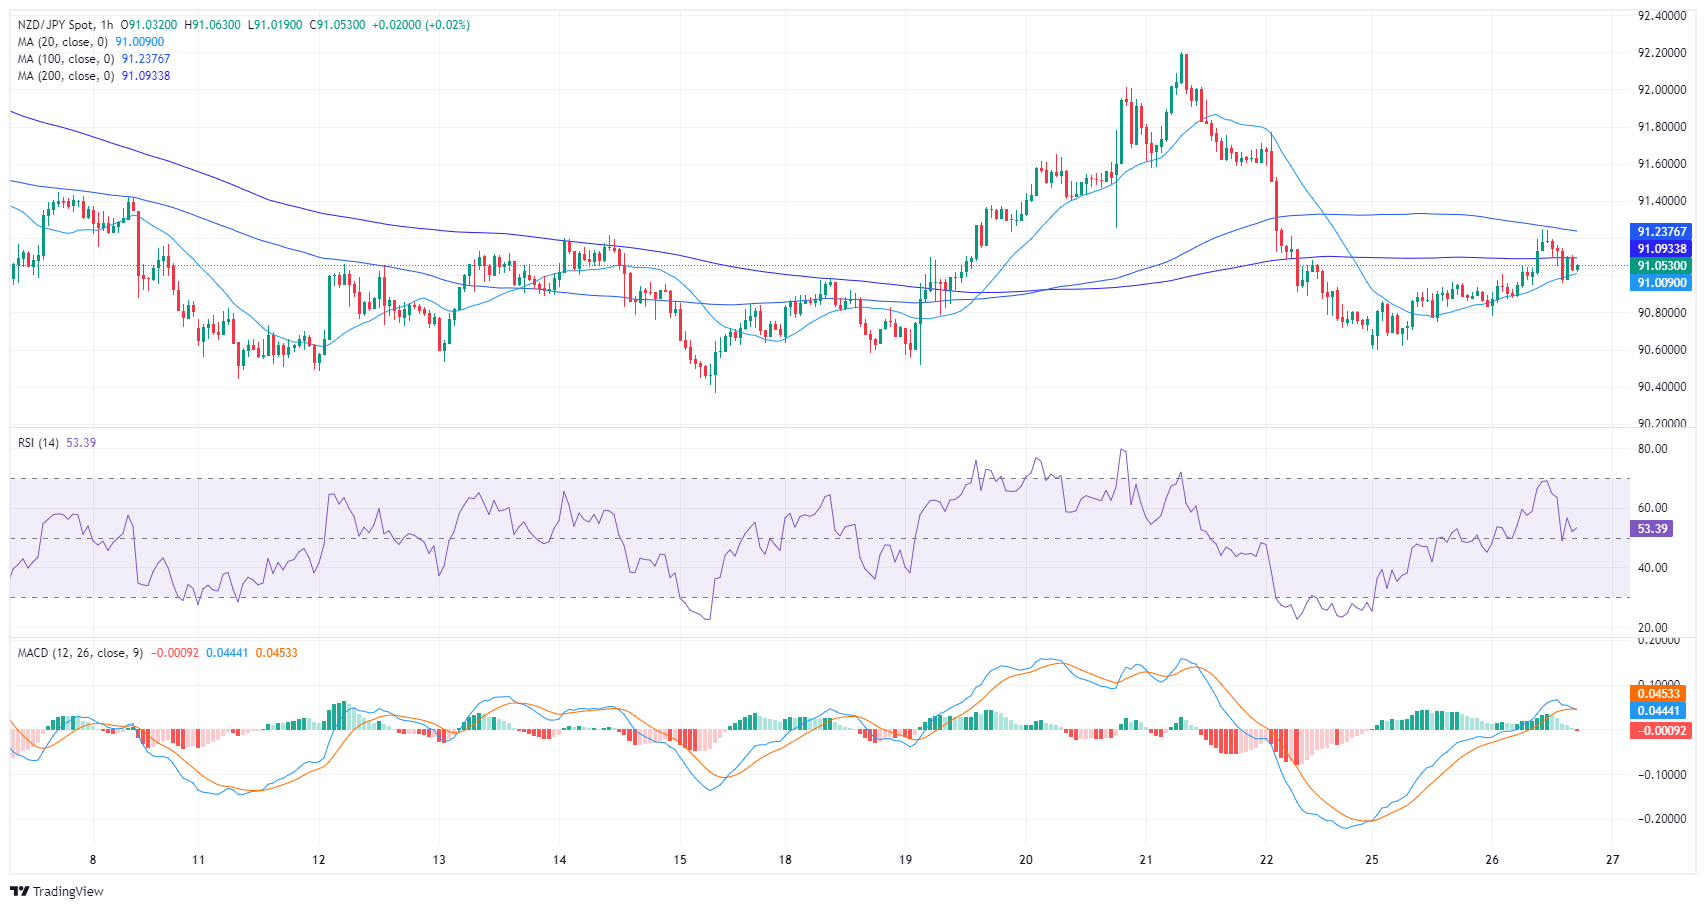
On the hourly chart, the RSI shows a slightly different picture, with the pair showing signs of bullish momentum. The RSI oscillates between negative and positive territories, with the most recent readings in the positive zone. This suggests that in the short term, buyers could be gaining control. However, the presence of ascending red bars on the moving average convergence divergence (MACD) histogram suggests that the bears are still present and the bears are around the corner.
NZD/JPY hourly chart
Even though the bears are currently holding firm, as evidenced by the fact that the pair is trading below the 20-day SMA, the overall trend remains bullish. This is demonstrated by the fact that the pair is trading above the 100-day and 200-day SMAs, indicating strong bullish momentum on broader timelines. That said, buyers should not relax and continue targeting the 20-day SMA for further upside.
Source: Fx Street
I am Joshua Winder, a senior-level journalist and editor at World Stock Market. I specialize in covering news related to the stock market and economic trends. With more than 8 years of experience in this field, I have become an expert in financial reporting.


