
- Natural Gas prices soar ahead of the US stock market session.
- Operators see the risk of a saturation of demand for cheap European Gas contracts.
- The US Dollar Index surpasses 104.00 and marks a three-day high.
He Natural Gas (XNG/USD) trades back above $1.87 and is heading for a three-day winning streak, while setting two-week highs. Operators see more room for growth, since the European Gas market is very saturated. Due to recent multi-year lows in prices, several foreign operators are entering the European Gas market, with Asia very active in purchasing contracts.
The US Dollar is dealing a blow to the markets by hitting three-day highs in the European session. Pending the second reading of the US Gross Domestic Product (GDP), the Dollar is rising again against most currencies. Risk aversion sentiment in Asia was the main trigger for the start of US Dollar strength this Wednesday.
Natural Gas is trading at $1.87 per MMBtu at the time of writing this report.
Movements in the Natural Gas market: Gas futures in Europe, on the rise
- The recent declines in Gas prices in Europe have stimulated purchases in other parts of the world.
- This could drive prices up in Europe and impact global Gas prices.
- China's Gas imports are expected to increase by 8.2% this year.
- Buyers are purchasing more Gas than they need, especially at current low prices.
- Turkey's Natural Gas imports have decreased by 8% in 2023, with Russia being the largest supplier.
- This Wednesday morning, EU President Ursula Von Der Leyen proposed starting to use frozen Russian assets to support Ukraine.
Natural Gas in Europe faces a hot summer with more and more market participants entering the bloc's Gas trading market. All the new additions are buyers, mainly from Asia, interested in the European Gas market with prices currently low for several years and the guaranteed price cap that the EU has put in place to protect households from rising prices. Gas prices after Russia reduced its supplies to Europe. Although Europe seems well equipped to refuel for the next heating season, the risk of some peaks in volatility could be on the horizon during the summer period.
To the upside, Natural Gas faces some fundamental technical levels to return to. Next up is the $1.99 level, which, when broken down, witnessed an accelerated decline. After that, the green line at $2.13 is in sight, with the 2023 triple bottom. If Natural Gas experiences a sudden spike in demand, $2.40 could come into play.
On the downside, $1.64 and $1.53 (the 2020 low) are targets to keep in mind. Another decline could occur if global growth starts to slow and there is less demand. If we add to that equation that the US and Canada are trying to release more Natural Gas extraction volume, the balance could quickly tip towards a market with excess supply and with more downward prices at hand.
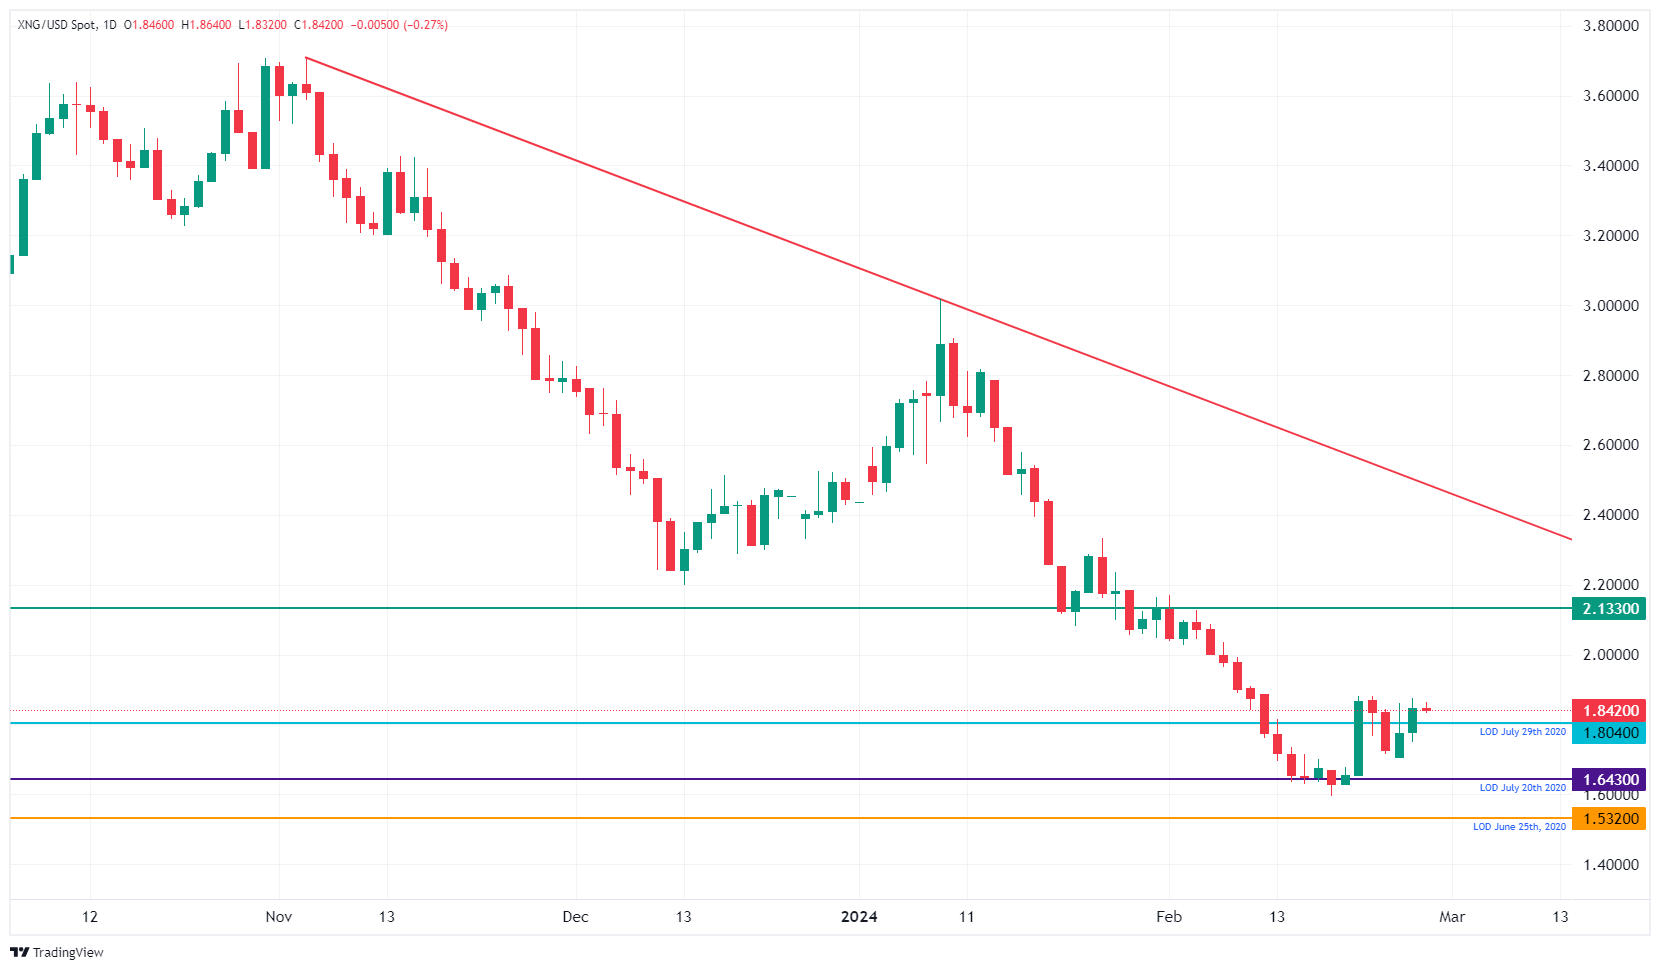
XNG/USD (daily chart)
Frequently asked questions about Gold
Why invest in Gold?
Gold has played a fundamental role in human history, as it has been widely used as a store of value and medium of exchange. Today, aside from its brilliance and use for jewelry, the precious metal is considered a safe-haven asset, meaning it is considered a good investment in turbulent times. Gold is also considered a hedge against inflation and currency depreciation, since it does not depend on any specific issuer or government.
Who buys more Gold?
Central banks are the largest holders of Gold. In their aim to support their currencies in turbulent times, central banks tend to diversify their reserves and purchase Gold to improve the perception of strength of the economy and currency. High Gold reserves can be a source of confidence for the solvency of a country. Central banks added 1,136 tons of gold worth about $70 billion to their reserves in 2022, according to data from the World Gold Council. This is the largest annual purchase since records exist. Central banks in emerging economies such as China, India and Turkey are rapidly increasing their gold reserves.
What correlation does Gold have with other assets?
Gold has an inverse correlation with the US Dollar and US Treasuries, which are the main reserve and safe haven assets. When the Dollar depreciates, the price of Gold tends to rise, allowing investors and central banks to diversify their assets in turbulent times. Gold is also inversely correlated with risk assets. A rally in the stock market tends to weaken the price of Gold, while sell-offs in riskier markets tend to favor the precious metal.
What does the price of Gold depend on?
The price of Gold can move due to a wide range of factors. Geopolitical instability or fear of a deep recession can cause the price of Gold to rise rapidly due to its status as a safe haven asset. As a non-yielding asset, the price of Gold tends to rise when interest rates fall, while rising money prices tend to weigh down the yellow metal. Still, most of the moves depend on how the US Dollar (USD) performs, as the asset is traded in dollars (XAU/USD). A strong Dollar tends to keep the price of Gold in check, while a weaker Dollar is likely to push up Gold prices.
Source: Fx Street
I am Joshua Winder, a senior-level journalist and editor at World Stock Market. I specialize in covering news related to the stock market and economic trends. With more than 8 years of experience in this field, I have become an expert in financial reporting.


