
- The price of gold breaks above $1,800 for the first time since August 2022.
- The dovish speech by Federal Reserve Chairman Jerome Powell weakened the US dollar.
- The Dollar Index falls below the 105.00 zone, while the US Treasury yield plunges to 3.60%.
The price of gold recovers and reaches a new maximum of three months after a message more “moderate” than expected from the president of the US Federal Reserve (Fed), Jerome Powell. Another factor weighing on demand for the US dollar is that the Federal Reserve’s preferred inflation gauge has not changed, while jobless claims have been lower than expected. At the time of writing, XAU/USD breaks above the $1800 mark for the first time since August.
Gold Soars on Powell’s Dovish Comments as Bond Yields Plunge
The XAU/USD remains on the rise and reaches highs since August 10 at 1804.2 dollarsafter moderated comments from Jerome Powell on Wednesday. Powell said that “the easing in the pace of rate hikes could come as soon as the December meetingcementing expectations that the Fed will move away from the 75 basis point hikes it has pursued over the past four meetings in favor of a slower 50 basis point pace. In the post-speech question and answer session , said “my colleagues and I don’t want to push too hardreferring to monetary policy.
In terms of data, the US economic agenda did not help the dollar, which continues to stumble after Powell’s speech. Core personal consumption spending (PCE), the Fed’s gauge of inflation, rose 5% on-year, down from 5.2% a month earlier, and in line with consensus, US Department of Finance data showed Thursday. Trade.
Meanwhile, initial jobless claims for the week ending November 26 rose by 225,000, below the 235,000 expected by analysts and below the previous week’s reading. The ISM manufacturing fell to 49 in Novemberits lowest level in 30 months.
Elsewhere, as the Dollar Index (DXY) plunges below the 105,000 mark, extending its daily losses to 1%, US Treasury yields plunge, with the US Treasury yield 10-year Treasury reaching 3,600%, while gold prices extended their gains.
Gold 1 hour chart
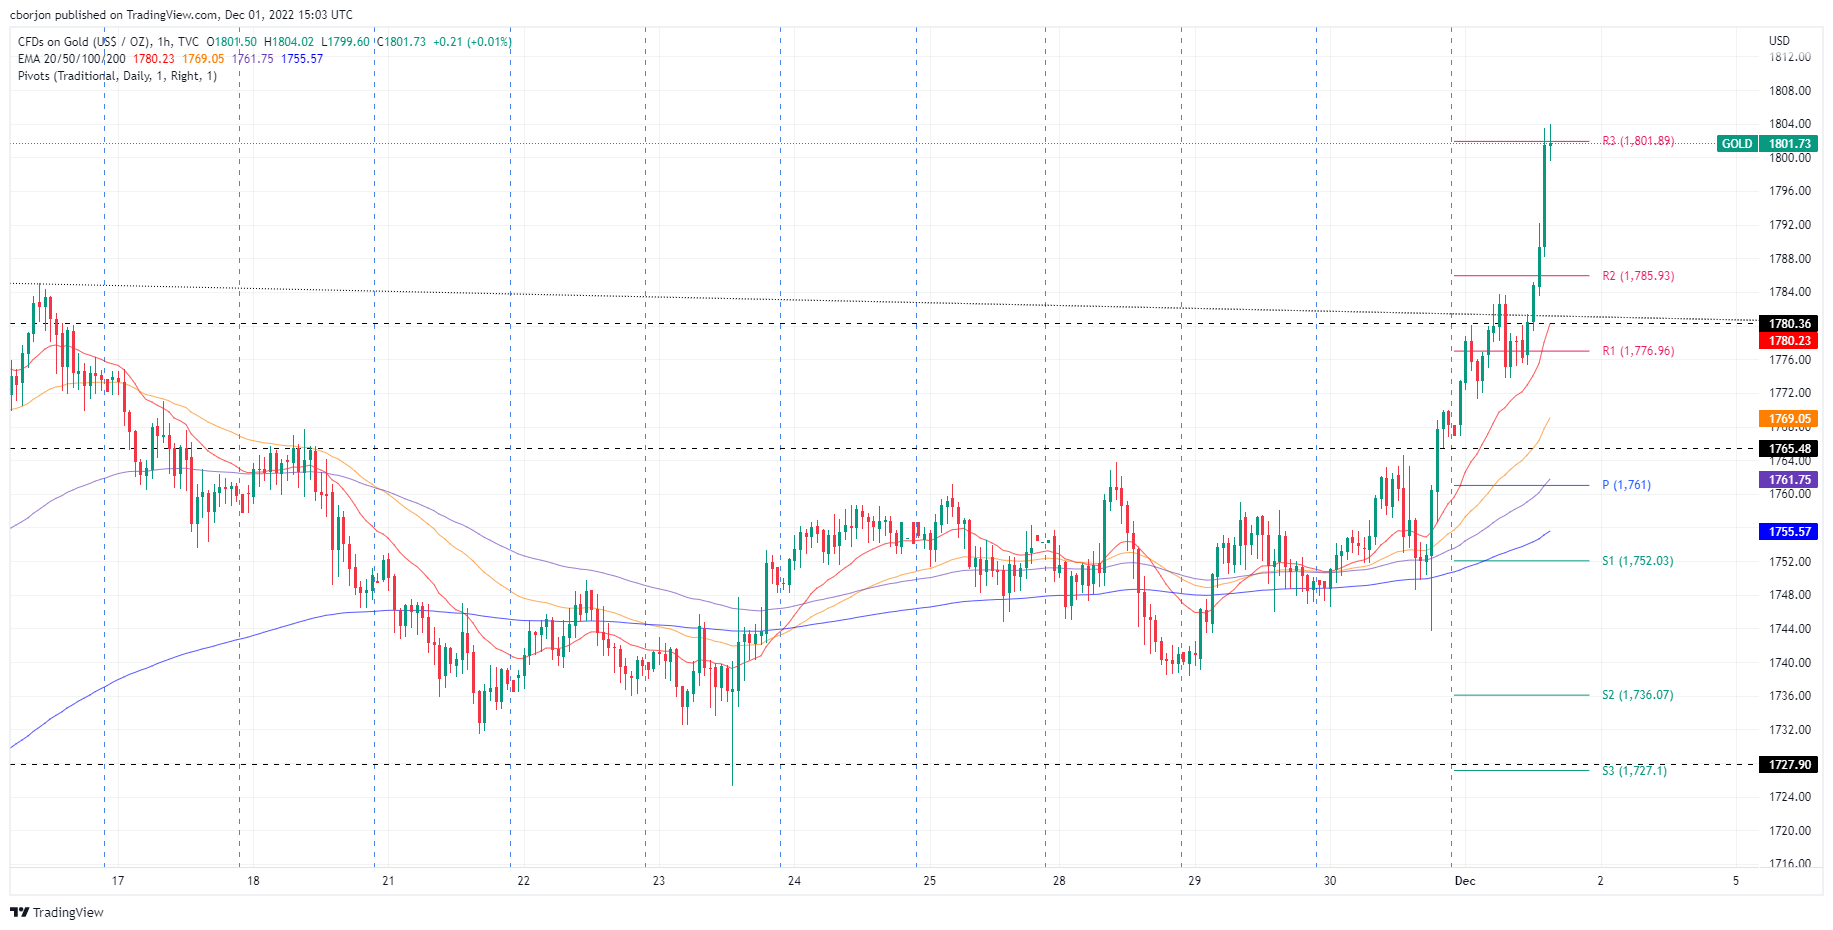
Key Gold Technical Levels
Source: Fx Street
I am Joshua Winder, a senior-level journalist and editor at World Stock Market. I specialize in covering news related to the stock market and economic trends. With more than 8 years of experience in this field, I have become an expert in financial reporting.


