
- Gold trims early gains on Friday following the release of higher-than-expected US PMI data.
- The data showed that US manufacturing and services activity remains strong, suggesting that inflation and interest rates will remain high for longer.
- XAU/USD’s breakout above key resistance invalidates the bearish head-shoulder pattern that formed on the daily chart.
He Gold (XAU/USD) has reversed earlier gains and returned below its 50-day SMA on an intraday basis following the release of S&P Global US Purchasing Managers’ Index (PMI) data, which showed that activity levels remained strengthened in both sectors in the month of June.
Gold was sold after the publication from US PMI data, which showed S&P Global’s preliminary manufacturing PMI rose to 51.7 in June from 51.3 in May, while the services PMI rose to 55.1 from 48.3 previously. Both results were higher than analysts expected.
After the data, Gold fell to $2,330. Higher PMIs indicate that inflation will likely remain elevated, resulting in the US Federal Reserve (Fed) having to delay when it will be able to reduce interest rates, a key determinant of the price of Gold. Lower interest rates are positive for the yellow metal, as they reduce the opportunity cost of holding gold, which does not pay coupons, compared to other assets such as bonds. Therefore, any delay in interest rate cuts weighs on Gold.
Gold supported by central bank purchases
Gold appears to continue to benefit from another factor influencing its price, central bank buying, according to a survey of international central bank reserve managers by the World Gold Council (WGC). The survey findings found that 81% of respondents think central banks would increase their holdings in 2024, the highest percentage since the survey began in 2019.
A large portion of the central bank buying has been by Asian central banks accumulating Gold as a hedge against a strengthening US Dollar. With the Fed reducing expectations for interest rate cuts from three to one in 2024, according to the latest Fed dot chart, the year has seen many Asian currencies depreciate significantly against the Dollar.
The trend of using Gold as a buffer against the strength of the US Dollar has been magnified by the increasingly partisan division of global trade between the BRICS nations and the West. An important pillar of the policy of the BRICS and its allies is to break the dominance of the US Dollar so that it cannot be used as a weapon against its members (which include Russia and now Iran) in sanctions. One of the few realistic replacements for the Dollar would be to trade in Gold-denominated financial assets.
The division between the BRICS and the West, moreover, has been accelerated by Russia’s invasion of Ukraine and Israel’s war against Hammas, which has divided the world along ideological and political lines. Since these conflicts are not destined to end anytime soon, they are likely to continue providing supporting demand for Gold, both as a potential medium of exchange and as a safe haven.
Technical Analysis: Gold breakout to the upside invalidates the head-shoulder pattern
Gold decisively breaks above a key resistance level at the 50-day SMA and a trend line connecting the May 7 and June 20 highs.
The breakout is critical as it invalidates the bearish head-shoulder pattern that had been forming on the daily chart.
XAU/USD Daily Chart
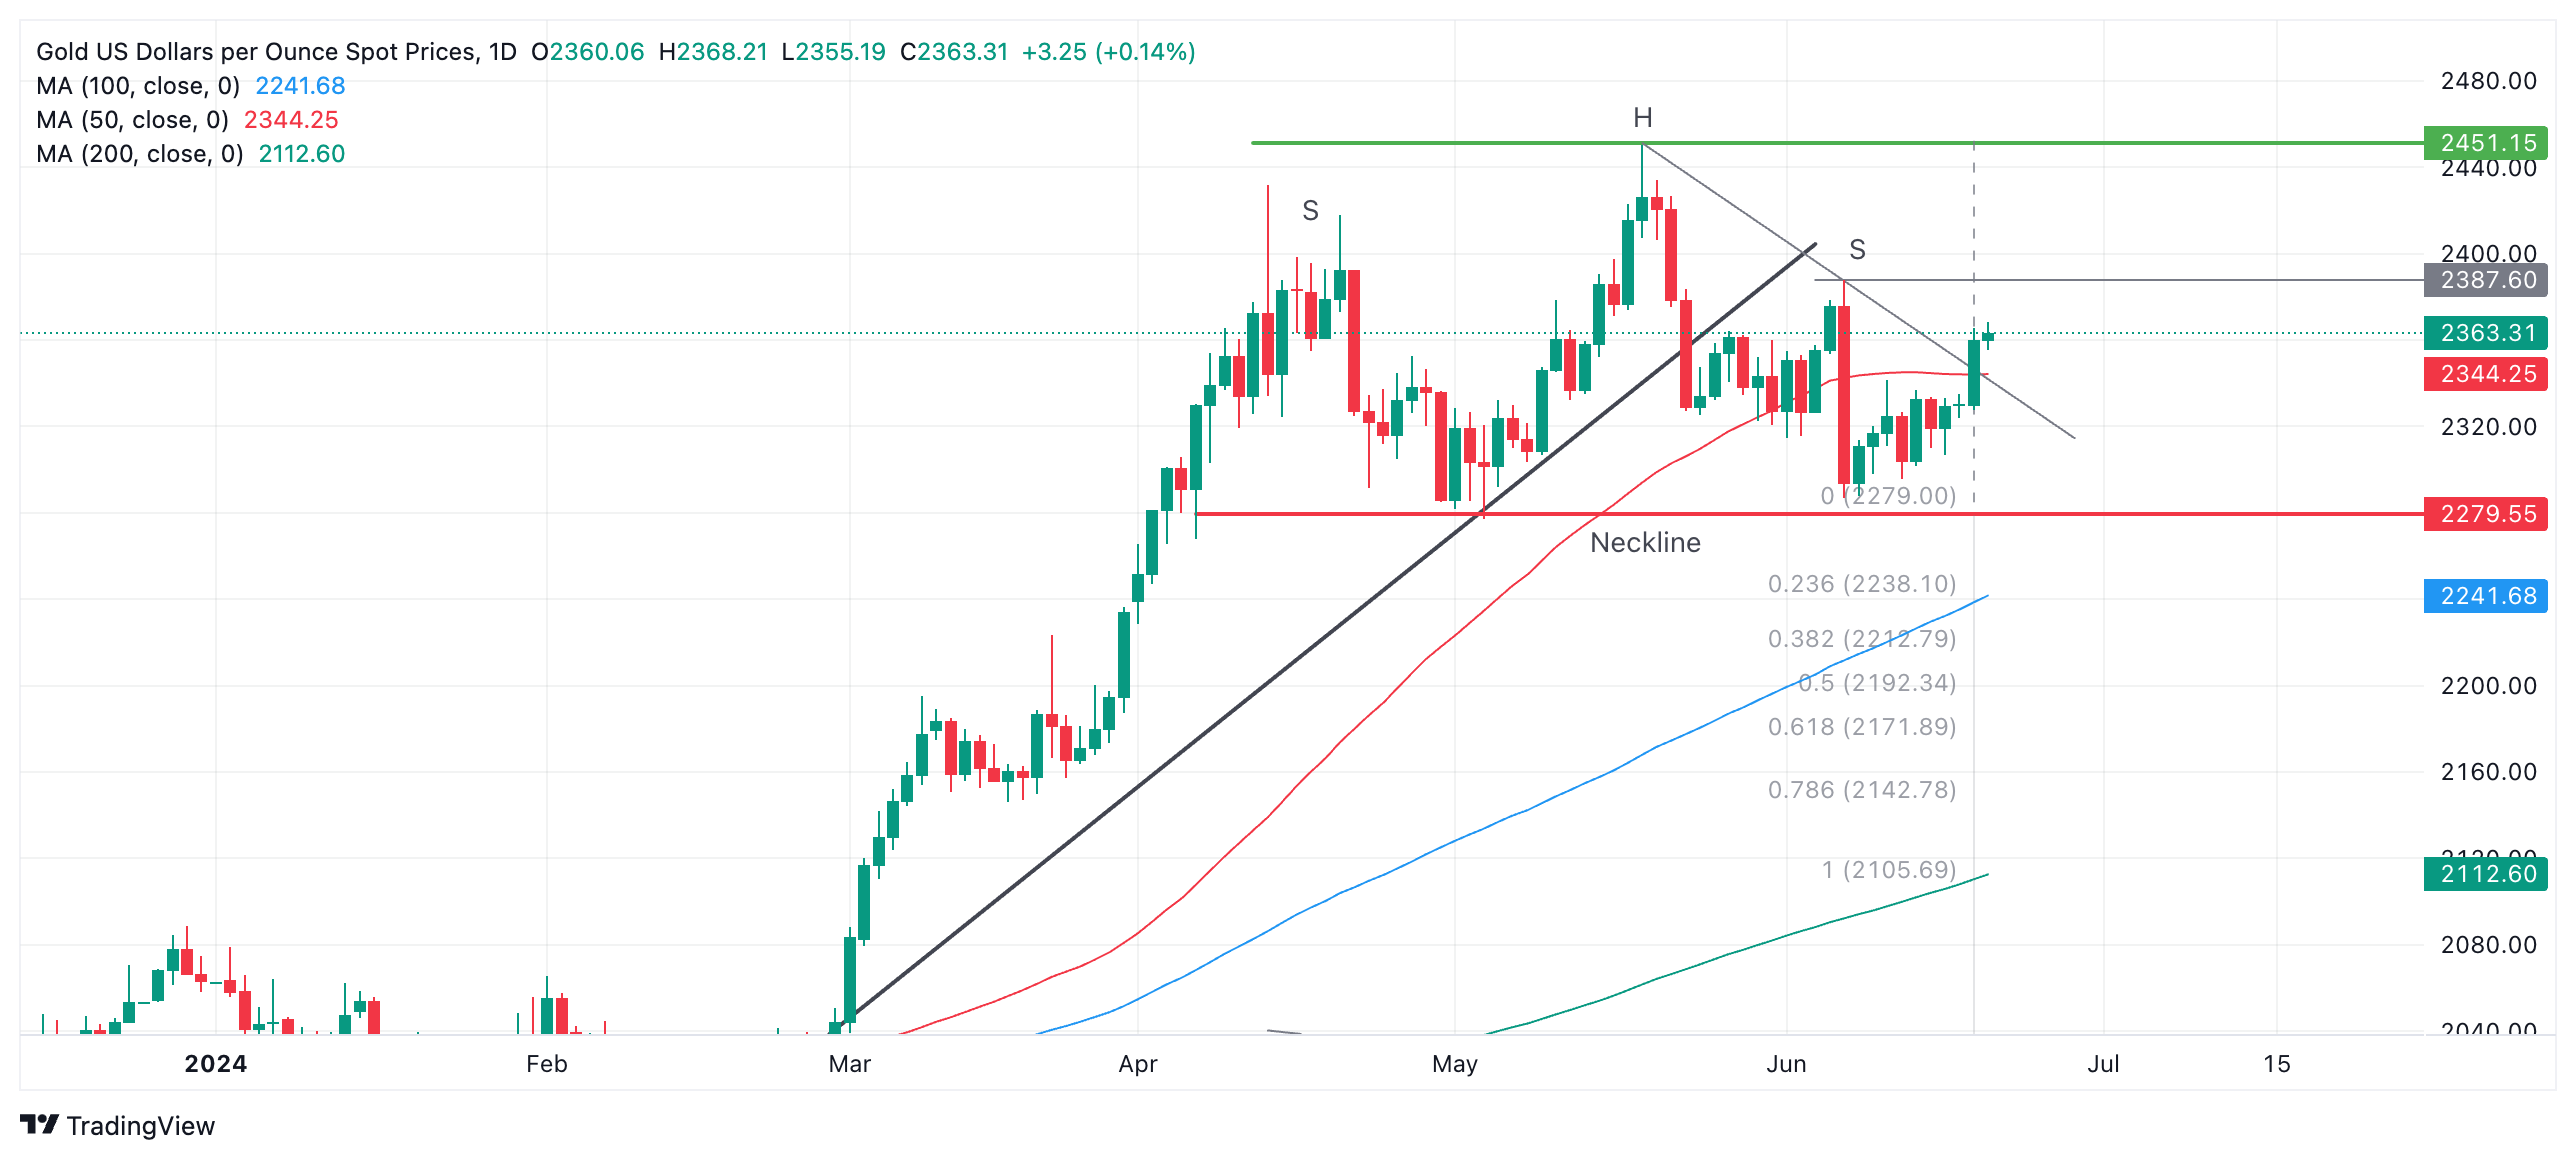
Gold’s upside follow-through after the breakout will likely hit an initial target in the $2,380 region (June 7 high).
A break above the June 7 high would indicate a likely continuation to the May – and all-time – high at $2,450.
A break above that would confirm a resumption of the broader uptrend.
economic indicator
S&P Global Services PMI
The Services Purchasing Managers Index (PMI) published by Markit Economics captures business conditions in the service sector. The PMI is an important indicator of economic conditions in the United States. A reading above 50 points indicates expansion in economic activity, while a reading below 50 points implies a decrease in activity. A result higher than expected is bullish for the USD, while a result lower than the consensus is bearish.
Source: Fx Street
I am Joshua Winder, a senior-level journalist and editor at World Stock Market. I specialize in covering news related to the stock market and economic trends. With more than 8 years of experience in this field, I have become an expert in financial reporting.


