
- Gold price has been hit with roadblocks around the 23.6% Fibonacci retracement at $1,880.00 as yields soar.
- The Fed’s Powell’s comments on interest rate guidance will be closely watched.
- The USD Index has recovered its four-week high at 103.28 amid a state of risk aversion.
The price of Gold (XAU/USD) is showing a sideways bid after building a cushion around $1,860.00 early in the Asian session. The precious metal is expected to show more weakness after giving up immediate support as US Treasury yields are gaining sharply ahead of Federal Reserve (Fed) Chairman Jerome Powell’s speech. The yield generated by the US 10-year Treasury Bonds has climbed at a breakneck pace to almost 3.65%.
Markets remained jittery on Monday as US-China tensions and tight US labor market data infused fresh blood into the Fed’s tightening policy. Risk aversion held the S&P500 on a consecutive negative trajectory for the second trading session. The Dollar Index (DXY) extended its bullish trajectory after breaching resistance at 102.80 and updated its four-week high at 103.28.
For further guidance, comments from the Fed’s Powell on the roadmap to tame stubborn inflation and new concerns about inflation projections due to a rebound in labor market conditions will be closely watched. Meanwhile, US Treasury Secretary Janet Yellen said on Monday the United States could avoid a recession as inflation is falling while the job market remains strong, Reuters reports.
Gold Technical Analysis
Gold price has felt a rejection after attempting to scale above the 203.6% Fibonacci retracement (placed from the Nov 3 low at $1,616.69 to Feb 2 high around $1,960.00) in around $1,880.00 on a four hour layover. A rejection around the 23.6% retracement indicates that the asset has been exposed to the next support at the 38.2% retracement around $1,829.45.
A bearish crossover, represented by the 20 and 50 period EMAs at $1,921.60, adds to the bearish filters.
Furthermore, the Relative Strength Index (RSI) (14) has drifted into the bearish range of $20.00-$40.00, indicating more weakness ahead.
Gold four hour chart
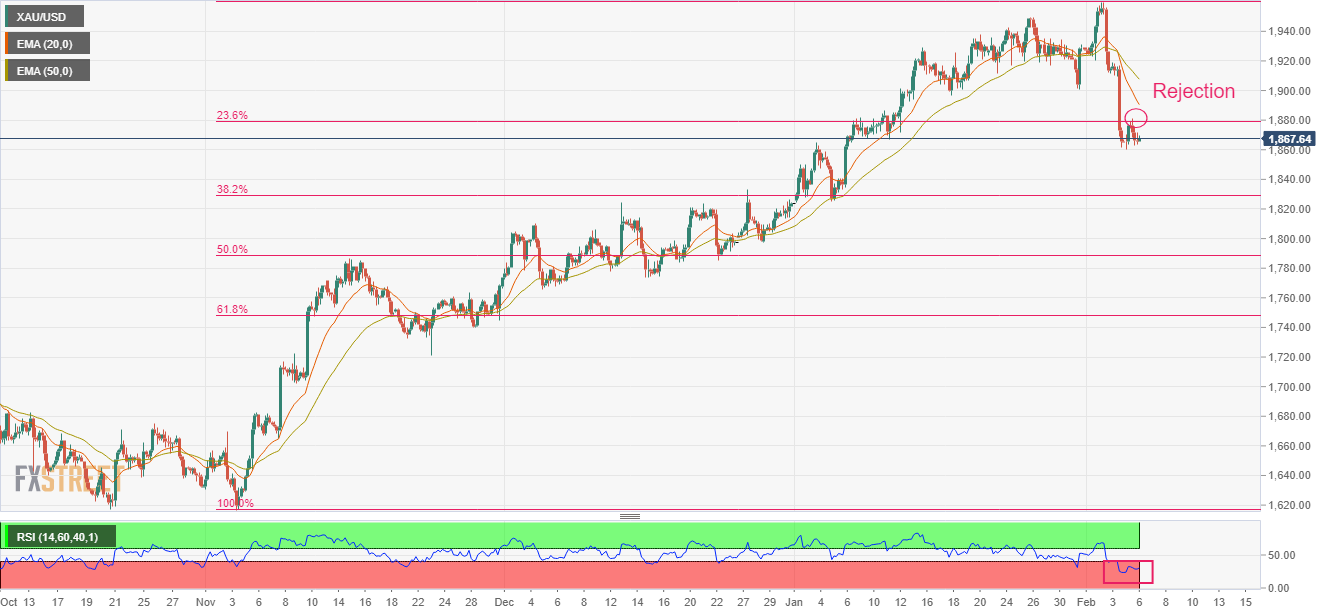
Source: Fx Street
I am Joshua Winder, a senior-level journalist and editor at World Stock Market. I specialize in covering news related to the stock market and economic trends. With more than 8 years of experience in this field, I have become an expert in financial reporting.


