
- XAU/USD sees a slight decline, remaining slightly above $2,018 with a minor pullback.
- Key indicators such as the RSI and MACD show moderate buying momentum as the bulls consolidate the December rally.
In the session on Friday, the XAU/USD pair was quoted at $2,018, presenting a slight decline of 0.08% and closing a weekly loss of 0.55%. After reaching $2,135 in December, buyers have taken a pause, suggesting a neutral to bullish outlook on the daily chart. Despite the momentum seen on the four-hour chart, the indicators remain relatively weak.
In addition, the recovery of the Dollar, driven by the adjustment of markets' bets on the Federal Reserve (Fed) due to the resistance of the US economy, is putting downward pressure on metals. On Friday, soft US December Personal Consumption Expenditure (PCE) numbers did not fuel a significant reaction to market expectations about the Fed meeting next week. At the moment, markets place the start of the easing cycle in May versus March, but the Fed's tone could change these expectations.
XAU/USD levels to watch
Technical indicators on the daily chart, namely the Relative Strength Index (RSI) and the metal's positioning relative to its 20, 100, and 200 Simple Moving Averages (SMA), paint a mixed picture. Even though the RSI is showing a negative slope and is currently in negative territory, the price manages to stay above the 20-day, 100-day, and 200-day SMAs. This is indicative of a bullish position on the broader time frame, and the recent pullback could be explained by the bulls taking a breather after taking the price to a high of $2,135 in December.
On the four-hour chart, momentum indicators present a weak but bullish tone. The four-hour RSI is showing a negative slope but is currently in positive territory, while the four-hour moving average convergence divergence (MACD) continues to produce flat red bars, again suggesting bearish positioning.
XAU/USD daily chart
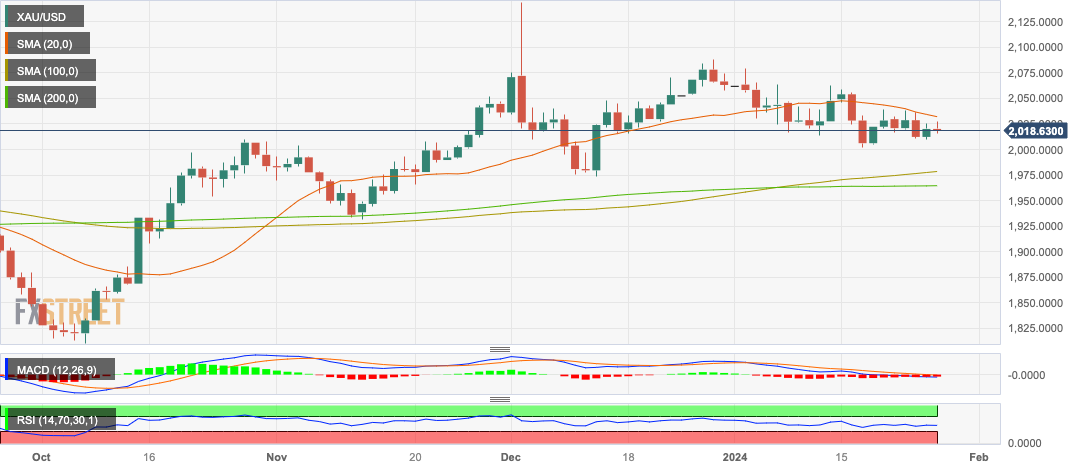
Source: Fx Street
I am Joshua Winder, a senior-level journalist and editor at World Stock Market. I specialize in covering news related to the stock market and economic trends. With more than 8 years of experience in this field, I have become an expert in financial reporting.


