
- The price of Gold rises slightly near $2,315, despite the strong recovery of the US Dollar.
- The worsening tensions in the Middle East maintain the falls in the price of Gold.
- US Dollar recovers after Neel Kashkari's Fed's hawkish guidance on interest rates.
The price of Gold (XAU/USD) struggles to find direction in the London session on Wednesday. The precious metal is stuck in a tight range slightly above the crucial support at $2,300.
The yellow metal rises modestly by 0.10% despite the strong recovery of the US Dollar. In general, the appeal of dollar-denominated Gold weakens when the US Dollar rises. The US Dollar Index (DXY), which tracks the dollar against six major currencies, recovers to 105.50. On Tuesday, Neel Kashkari, president of the Minneapolis Federal Reserve (Fed), was very optimistic about interest rates, which reinforced the attractiveness of the US dollar.
Neel Kashkari said he wants to see multiple positive inflation readings, which could build confidence that inflation is on track to return to the desired rate of 2%, before moving to a policy normalization stance. Kashkari was in favor of keeping interest rates stable throughout the year, since progress in the disinflation process has stalled due to the strength of the real estate market.
The lack of progress in speculation about a ceasefire between Israel and Palestine has kept the price of Gold well supported. Israel intends to extend its military activities to Rafah, the southern area of Gaza, where it believes displaced Palestinians have taken refuge.
Expectations of a truce between Israel and Palestine soften after Israel denied the ceasefire proposal agreed to by Palestine. Historically, worsening geopolitical tensions improve demand for safe-haven assets, such as Gold.
Technical analysis of Gold
The price of Gold remains in the $2,280-$2,330 area for more than a week, showing indecision among market participants. The precious metal remains glued to the 20-period EMA around $2,314.60, suggesting future consolidation.
The 14-period RSI is oscillating in the 40.00-60.00 range, indicating a strong contraction in volatility.
Gold four-hour chart
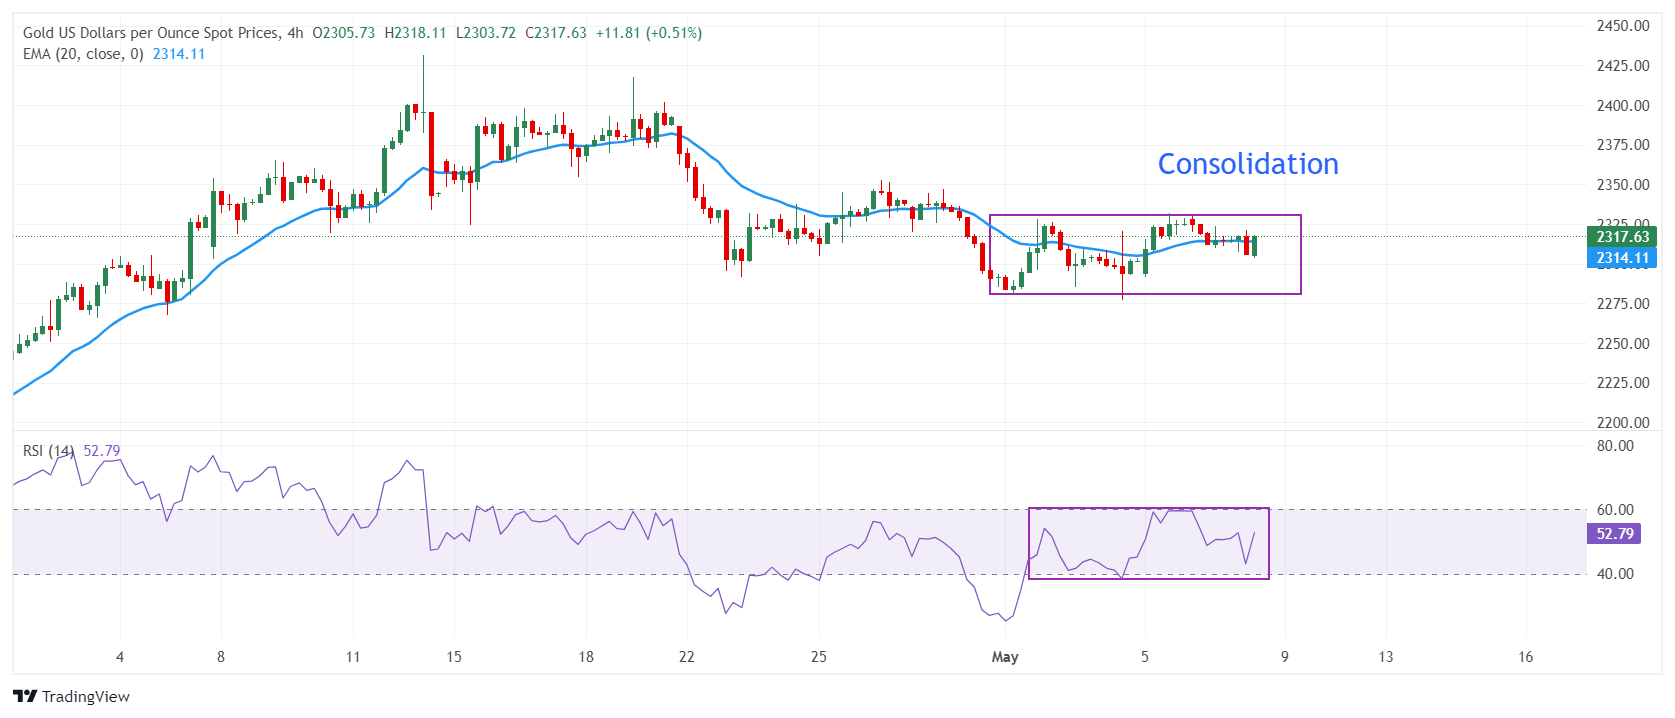
Source: Fx Street
I am Joshua Winder, a senior-level journalist and editor at World Stock Market. I specialize in covering news related to the stock market and economic trends. With more than 8 years of experience in this field, I have become an expert in financial reporting.


