
- The US Producer Price Index moderated in November, but not enough.
- Market participants await the US Federal Reserve’s monetary policy decision next week.
- The XAU/USD pair keeps its upside potential intact, despite the lack of follow-through.
Gold rose as high as $1,804.43 before the US open, but quickly pulled back and is currently trading around $1,797 a troy ounce. The US dollar continues to fall despite the bad mood in the markets, as the US Producer Price Index (PPI) failed to impress. According to the US Bureau of Labor Statistics, inflation at the wholesale level rose to an annual rate of 7.4% in November, meeting market expectations. However, the core index, which excludes volatile food and energy prices, rose 6.2%, down from 6.7% previously, but above the 6% forecast.
Demand for US dollars is limited ahead of next week’s critical US Federal Reserve (Fed) monetary policy decision. The central bank could slow the pace of tightening and move up 50 basis points before pausing, ending the most aggressive cycle in its history. However, speculative interest still sees a modest chance of another 75 basis point rise amid resilient economic data.
XAU/USD Technical Outlook
The X AU/USD pair pared its initial weekly losses and is trading flat compared to Monday’s open. Even so, it managed to record a higher low and high, keeping the upside potential intact. However, the yellow metal still cannot overcome the psychological resistance of the 1,800 dollars. Once overcome, gold has a clear path to the price zone of $1,850. A short-term support level is located at $1,780while increased buying interest lines up around $1,765.
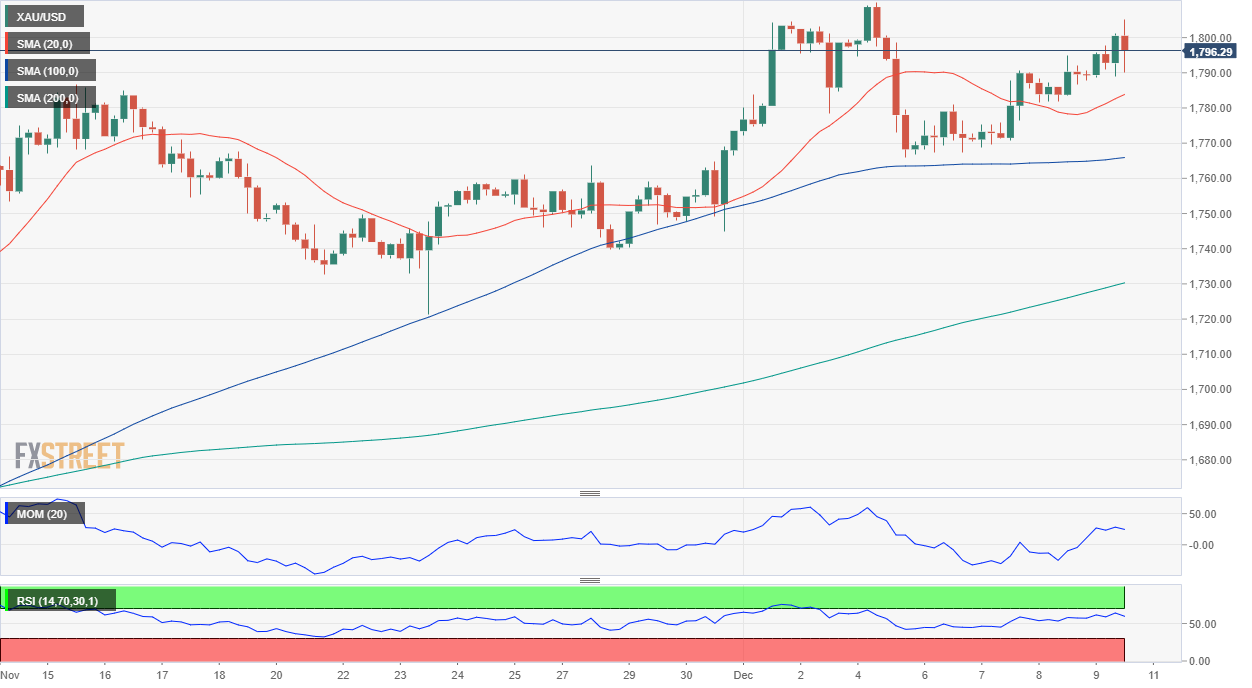
Source: Fx Street
I am Joshua Winder, a senior-level journalist and editor at World Stock Market. I specialize in covering news related to the stock market and economic trends. With more than 8 years of experience in this field, I have become an expert in financial reporting.


")
")
