
- Downward revision of fourth quarter GDP in the US, upward revision of inflation indicators.
- Jobless claims and Chicago Fed activity exceeded expectations.
- Gold’s rebound fails to exceed $1,830.
gold prices They bounced after hitting fresh monthly lows amid risk appetite and an intraday US dollar reversal. The XAU/USD pair bottomed at $1,817 after the US economic data release, the lowest level since late December, and then rallied towards the $1,830 zone.
Data published in the US were mixed. Initial claims for jobless benefits fell to 192,000, the lowest level in three weeks. The second reading of fourth-quarter GDP showed a lower annualized growth rate of 2.7%, down from the 2.9% previous estimate. GDP inflation indicators reported an upward revision. The Chicago Fed National Activity Index rose from -0.43 to 0.23, beating expectations.
Investors continue to digest the FOMC minutes and new economic figures. The Dow Jones rises 0.43% and the Nasdaq 0.50%. US yields are down slightly, hovering around monthly highs.
The dollar peaked after the US data release, while gold bottomed at $1,817, the lowest level since December 30. Subsequently, the yellow metal bounced towards $1,830, but failed to break above that key level any time soon.
After the opening bell on Wall Street, the dollar gained momentum again and pushed XAU/USD lower again. XAU/USD is approaching the $1,820 area, which is critical. A consolidation below would open the doors to further weakness, targeting $1,812 initially.
XAU/USD daily chart
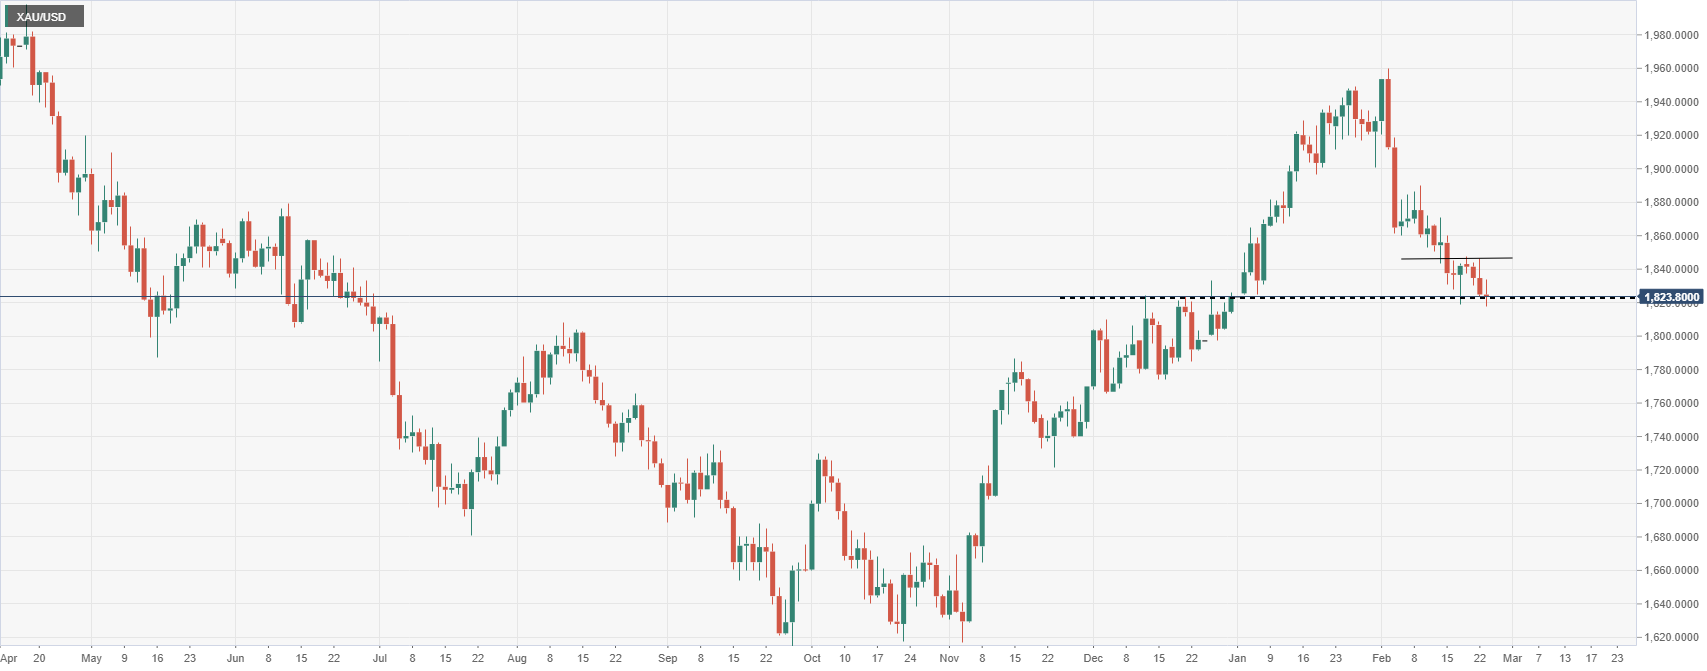
Source: Fx Street
I am Joshua Winder, a senior-level journalist and editor at World Stock Market. I specialize in covering news related to the stock market and economic trends. With more than 8 years of experience in this field, I have become an expert in financial reporting.


, but the public did not notice")


