
- The GBP/USD pair is testing three-month lows after closing flat or bearish for seven of the last eight weeks.
- UK data continues to disappoint, suggesting a bleak economic outlook.
- US data continues to beat expectations, boosting the Dollar across major trading pairs.
The British Pound (GBP) is notably bearish for Thursday, briefly breaking below 1.2400 against the Dollar (USD), while bears keep GBP pinned to the ground.
Risk appetite remains around the British Pound after Wednesday’s disappointing performance in the United Kingdom (UK) economic docket. UK Gross Domestic Product (GDP) figures fell more than markets expected, as the July figure fell 0.5%, worse than the 0.2% decline expected and negating the month’s 0.5% gain. former.
Pound bulls were held back by weak UK economic data.
Industrial Production for the same month also failed to meet forecasts, since the July figure was -0.7% (-0.6% forecast), worse than expected, which represented a significant cut from the 1.8% increase in the previous month.
Wednesday’s US Consumer Price Index (CPI) figures provided great support to the dollar, as August inflation figures stood at 0.6%, as expected, which represents an acceleration compared to the 0.2% of the previous month.
Initial claims for unemployment benefits, the Producer Price Index (PPI) and retail sales were published in the United States on Thursday.
Initial claims for unemployment benefits for the week of September 8 were better than expected, with 220,000 new claims compared to the 225,000 expected. The previous week there were 217,000.
The PPI for August exceeded forecasts and stood at 0.7%, compared to 0.4% expected. Retail sales also improved, rising to 0.6% from 0.5% the previous month, and reversing the reversal of market forecasts to 0.2%.
On Friday, the economic calendar will be firmly in the hands of the Dollar bulls, as the Michigan Consumer Sentiment Index will show a slight decline from 69.1 to 69.5. If the indicator holds or beats expectations, it could give the dollar the boost it needs to extend gains into the weekly close.
GBP/USD Technical Outlook
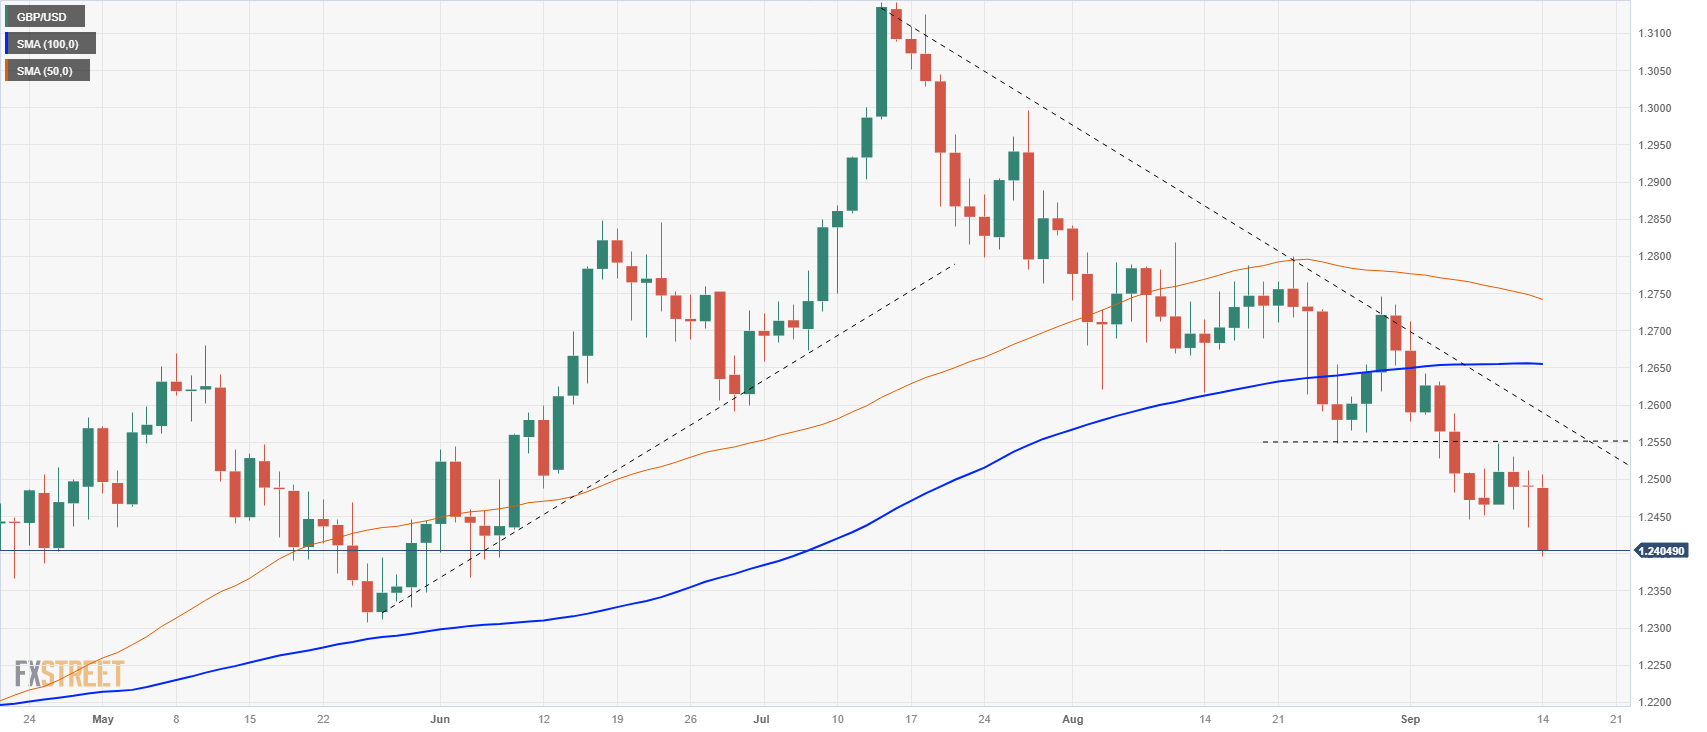
The British pound made a fresh daily low below the 1.2400 zone during trading on Thursday. Recent declines have taken the pair well below the 100-day SMA, currently at 1.2650, and the 50-day SMA has turned bearish from 1.2750.
If the GBP/USD decline continues, the late May lows near 1.2300 will be called into question, while if there is a recovery by the bulls, the latest low near 1.2550 will act as short-term resistance.
GBP/USD daily chart
GBP/USD technical levels
Source: Fx Street
I am Joshua Winder, a senior-level journalist and editor at World Stock Market. I specialize in covering news related to the stock market and economic trends. With more than 8 years of experience in this field, I have become an expert in financial reporting.


