
- The US dollar will end the week with solid gains on hawkish comments from the Fed and US data.
- US consumer sentiment improved, the University of Michigan reported.
- The UK avoided a recession in the fourth quarter of 2022, although its forward economic outlook suggests a weaker sterling.
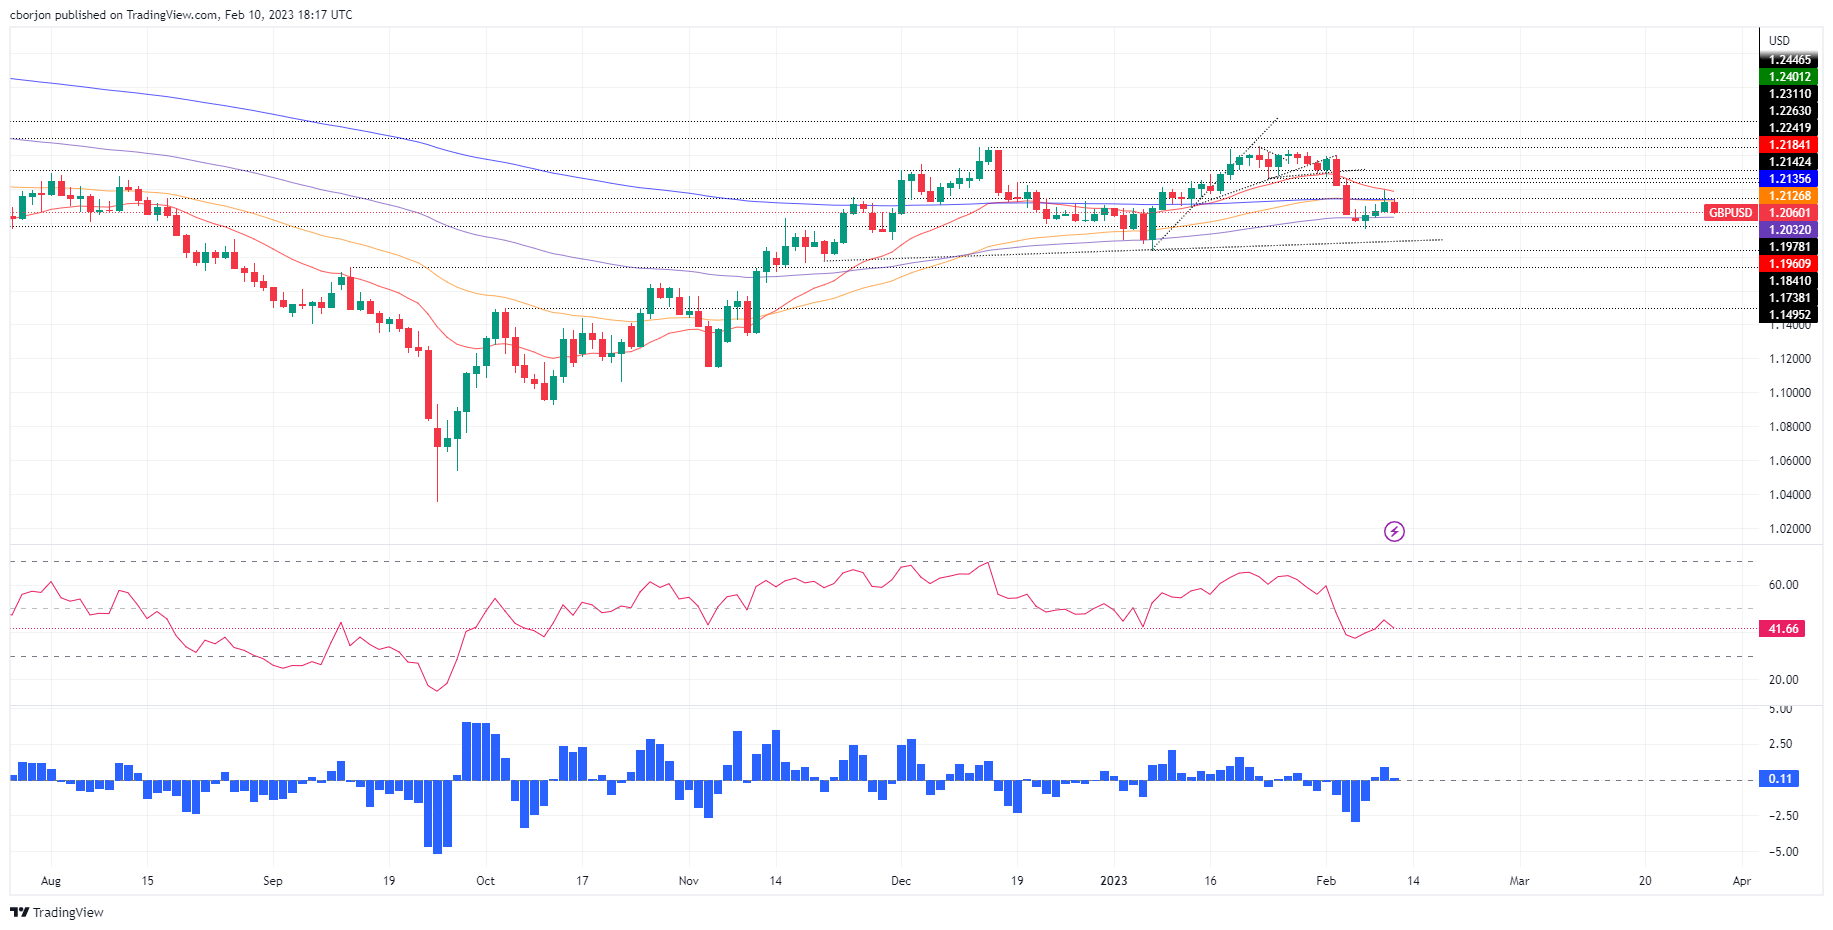
- GBP/USD Price Analysis: A daily close below 1.2032 would resume a bearish continuation.
He GBP/USD It breaks three straight days of gains and falls to test the 50-day EMA at 1.2126, as UK economic data showed the economy did not grow, while US consumer sentiment declined. USA got better. At the time of writing these lines, the GBP/USD pair is trading at 1.2055.
Improved US consumer sentiment and weak UK GDP weighed on the GBP.
GBP/USD extended a leg lower after University of Michigan (UoM) data reported that Consumer Sentiment beat predictions of 65 and rose to 66.4, indicating better financial conditions. In addition, the expected inflation rate for the year rose from the 3.9% final reading in January to 4.2%, while inflation estimates for a five-year period held steady at 2.9%.
Therefore, the Dollar Index (DXY), a measure of the value of the greenback against a basket of pairs, advanced 0.60% to 103.65, supported by US Treasury yields, which , affected by the hawkish comments of the spokesmen of the Federal Reserve (Fed) during the last week, broke the threshold of 3.70% to 3.728%.
During the European session, the British economic agenda revealed that the GDP for the last three months of 2022 stood at 0% and avoided entering a recession, predicted by the Bank of England (BoE). In monthly terms, December’s GDP contracted -0.5%, reported the Office for National Statistics (ONS).
Meanwhile, a bleak scenario in the UK suggests the British pound (GBP) may be under pressure as the BoE struggles to tame inflation, which hit a 41-year high of 11.1% in October 2022. The last BOE monetary policy meeting revealed a divided vote among its members. Discussions and guidance from the BoE, which could reaffirm the central bank’s commitment to tackling inflation, would be interesting.
GBP/USD Technical Analysis
From a daily chart perspective, GBP/USD would consolidate within the limits of the 50 day EMA at 1.2126 on the upside and the 100 day EMA at 1.2032 on the downside. However, the Relative Strength Index (RSI) entered bearish territory, and the Rate of Change (RoC) turned neutral, making a case for a bearish continuation. Therefore, the next support for the GBP/USD would be the 100 day EMA at 1.2032, followed by the psychological figure of 1.2000. A decisive break could lead GBP/USD to test the low of 1.1841.
Source: Fx Street
I am Joshua Winder, a senior-level journalist and editor at World Stock Market. I specialize in covering news related to the stock market and economic trends. With more than 8 years of experience in this field, I have become an expert in financial reporting.


