
- GBP/USD is moving with upward momentum and is trading above 1.2750 on Thursday.
- GBP’s gains were bolstered by market expectations of less monetary easing by the Bank of England in 2024.
- On the other hand, dovish expectations about the Fed weakened the US dollar.
The GBP/USD pair soared following the Bank of England (BoE) decision on Thursday and reached its highest point since August, around 1.2775. The rapid rise was largely motivated by the central bank’s hawkish policy stance, which has boosted the British pound against the US dollar.
Along these lines, the BoE has once again maintained interest rates at 5.25%, continuing this trend for the third consecutive time. Despite this, a signal was given towards additional monetary tightening if lasting inflationary pressures occur. Governor Andrew Bailey highlighted the possibility of future tightening of monetary policy, while maintaining the stance of higher interest rates for longer. Regarding the division of the vote, three of the nine members of the Monetary Policy Committee (CPM) were in favor of an incremental increase in interest rates from 0.25% to 5.50%.
Following the decision, swap markets have adjusted their expectations regarding BoE rate cuts. They previously anticipated a total of 115 basis points in cuts by the end of next year, but following today’s decision, investors now see 107 basis points of easing. In line with this, the British pound gained strength against the dollar, as the Federal Reserve (Fed) hinted on Wednesday that there will be more easing than expected in 2024.
GBP/USD levels to watch
The indicators on the daily chart reflect that the buying momentum is significantly outweighing the selling pressure. First of all, the steep positive slope of the Relative Strength Index (RSI) is a strong indication that buyers are dominating this market, pushing it into positive territory.
Meanwhile, the MACD is printing ascending green bars, further suggesting that the pair is finding strong buying interest.
Lastly, if we look at the simple moving averages (SMAs), the pair is trading comfortably above its 20-day, 100-day, and 200-day SMAs on the longer timeframes. This positioning above these key SMAs adds more weight to a bullish outlook, implying that buyers are firmly in control over the long term.
Support levels: 1.2670, 1.2630 and 1.2600 (20-day SMA).
Resistance levels: 1.2760, 1.2800 and 1.2830.
GBP/USD daily chart
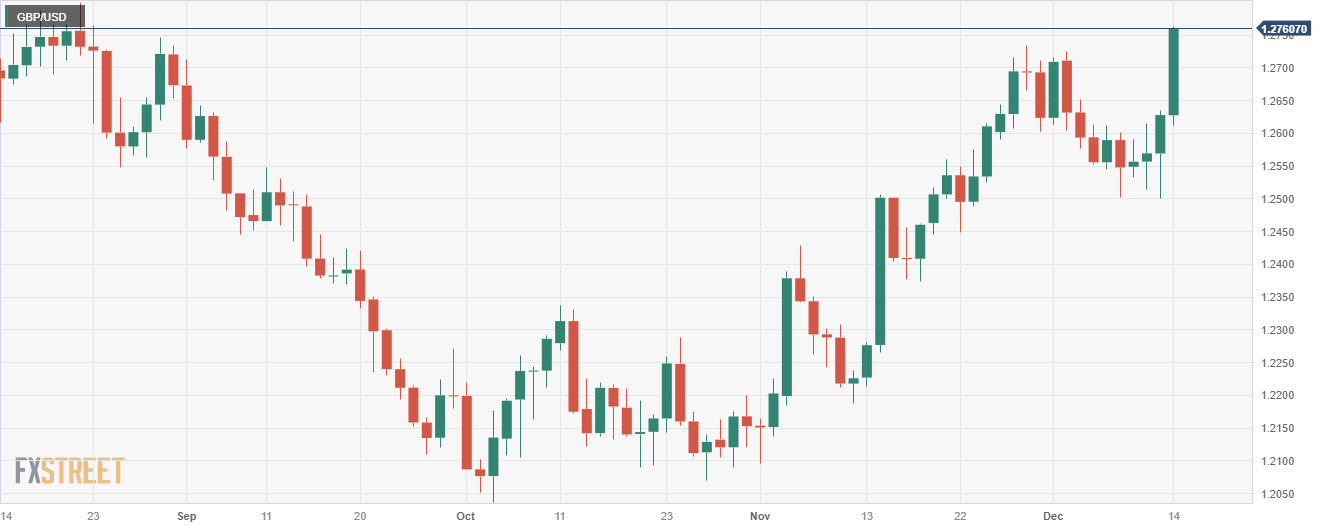
Source: Fx Street
I am Joshua Winder, a senior-level journalist and editor at World Stock Market. I specialize in covering news related to the stock market and economic trends. With more than 8 years of experience in this field, I have become an expert in financial reporting.


