
- GBP/USD is nearing weekly lows amid the looming political crisis in the UK.
- Markets are risk averse but US dollar fails to capitalize ahead of data and Fed statement.
- GBP/USD needs a daily close below 1.1222 to extend current bearish momentum.
The GBP/USD moves lower during the European session, maintaining its range around 1.1200since sellers remain in control amid concern over UK leadership crisis. Although some Conservative MPs (Tories) continue to show their confidence in the Prime Minister of the United Kingdom, Liz Truss, several members of the bench ask for the relief of the leadership after the recent fiscal fiasco.
According to the ITV television network, some ministers indicated that the resignation of Prime Minister Truss will be requested, either in the next few days or after October 31. For its part, TimesRadio reported that three Tory MPs told the British media that Liz Truss has to resign now. The abrupt resignation of British Home Secretary Suella Braverman on Wednesday raises questions about the Prime Minister’s leadership authority.and political tensions in the UK keep GBP/USD at weekly lows.
Furthermore, comments from the BoE deputy governor, Ben Broadbent, are also putting downward pressure on the pound. Broadbent casts doubt on market prices, causing terminal rate expectations to be lowered further by about 15 basis points since Wednesday’s close. The deputy governor of the BoE said that “it remains to be seen whether official interest rates have to rise as much as currently valued in financial markets“.
Nevertheless, pair’s losses appear capped by weaker US dollar, although Treasury yields remain near multi-year highs. The focus now turns to jobless claims and US housing data, while speeches from Fed officials will also be closely scrutinized for new dollar valuations.
From a short-term technical perspective, the GBP/USD has broken the support of the rising trend line on the daily chart, on 1.1222.
A daily close below this level is needed to confirm a breakout to the downside and extend the downtrend towards the slightly bearish 21-day SMA at 1.1132.
Below, the level of 1.1100 It will be on the sellers’ radar. The 14-day RSI is dipping below the midline, what favors the downtrend.
GBP/USD daily chart
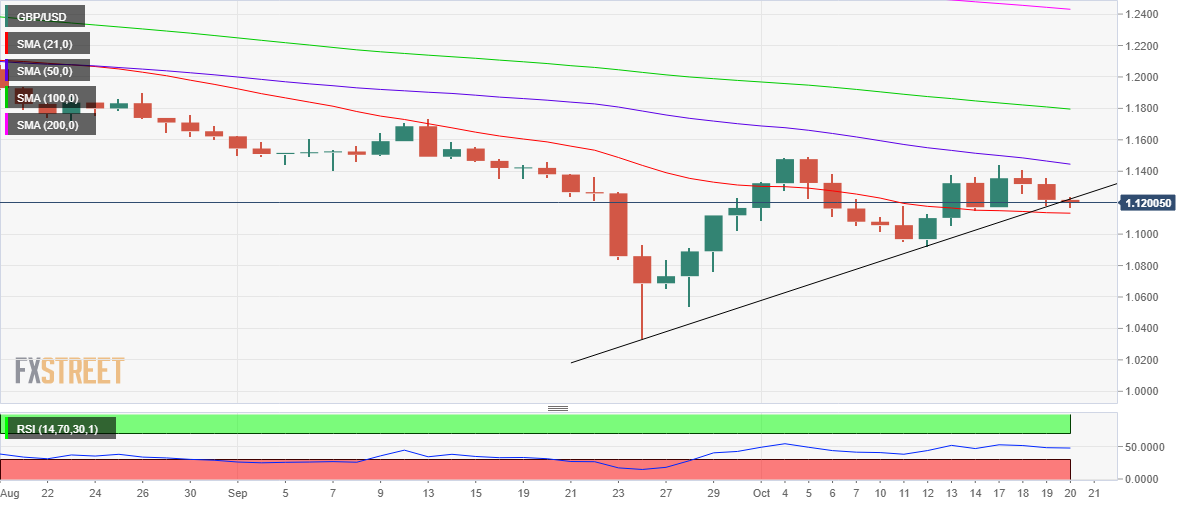
On the other hand, reclaiming the aforementioned trend line support now turned resistance is critical to any meaningful recovery of the pair.
The next upside barrier is the previous day’s high at 1.1358above which the 50 SMA could come into play in 1.1444.
GBP/USD additional technical levels
Source: Fx Street
With 6 years of experience, I bring to the table captivating and informative writing in the world news category. My expertise covers a range of industries, including tourism, technology, forex and stocks. From brief social media posts to in-depth articles, I am dedicated to creating compelling content for various platforms.


