
- GBP/USD stable mid-North American session following US data, with weak inflation driving rate cut expectations.
- The US PCE index shows stable headline inflation at 2.6%; the underlying rate falls to 2.9%, pointing to a possible Fed rate cut in May.
- The focus is on upcoming central bank decisions: the Fed is likely to hold rates and so is the BoE.
The pair GBP/USD was virtually unchanged in the North American mid-session on Friday, following the release of US data. A softer inflation reading was applauded by investors, who remained confident that the Federal Reserve (Fed) would cut rates in May. Despite this, the major pairs remain flat, hovering around 1.2700, poised to end the week with minuscule gains.
GBP/USD holds around its opening price after weak US PCE data; Operators are attentive to the decisions of central banks
The US Department of Commerce released the personal consumption expenditure (PCE) price index, which suggests that inflation continues its downward trend. Headline inflation rose 2.6%, unchanged from November and expected numbers, while underlying measures fell from 3.2% to 2.9%. Although the data could allow for a rate cut by the Fed, investors estimate that the first would occur in May, according to the Chicago Board of Trade (CBOT). Money market traders expect Fed Chair Jerome Powell and company to lower rates to 4% by the end of the year.
Given the fundamental backdrop, GBP/USD traders are keeping an eye on monetary policy decisions from both central banks next week. The Fed is expected to keep rates unchanged on January 31, although market participants will be watching Powell's press conference.
Across the pond, the Bank of England (BoE) is expected to keep the bank rate at 5.25%, albeit with a unanimous vote, down from the previous 6-3 split on February 1. Investors are awaiting the publication of the economic projections and the BoE press conference.
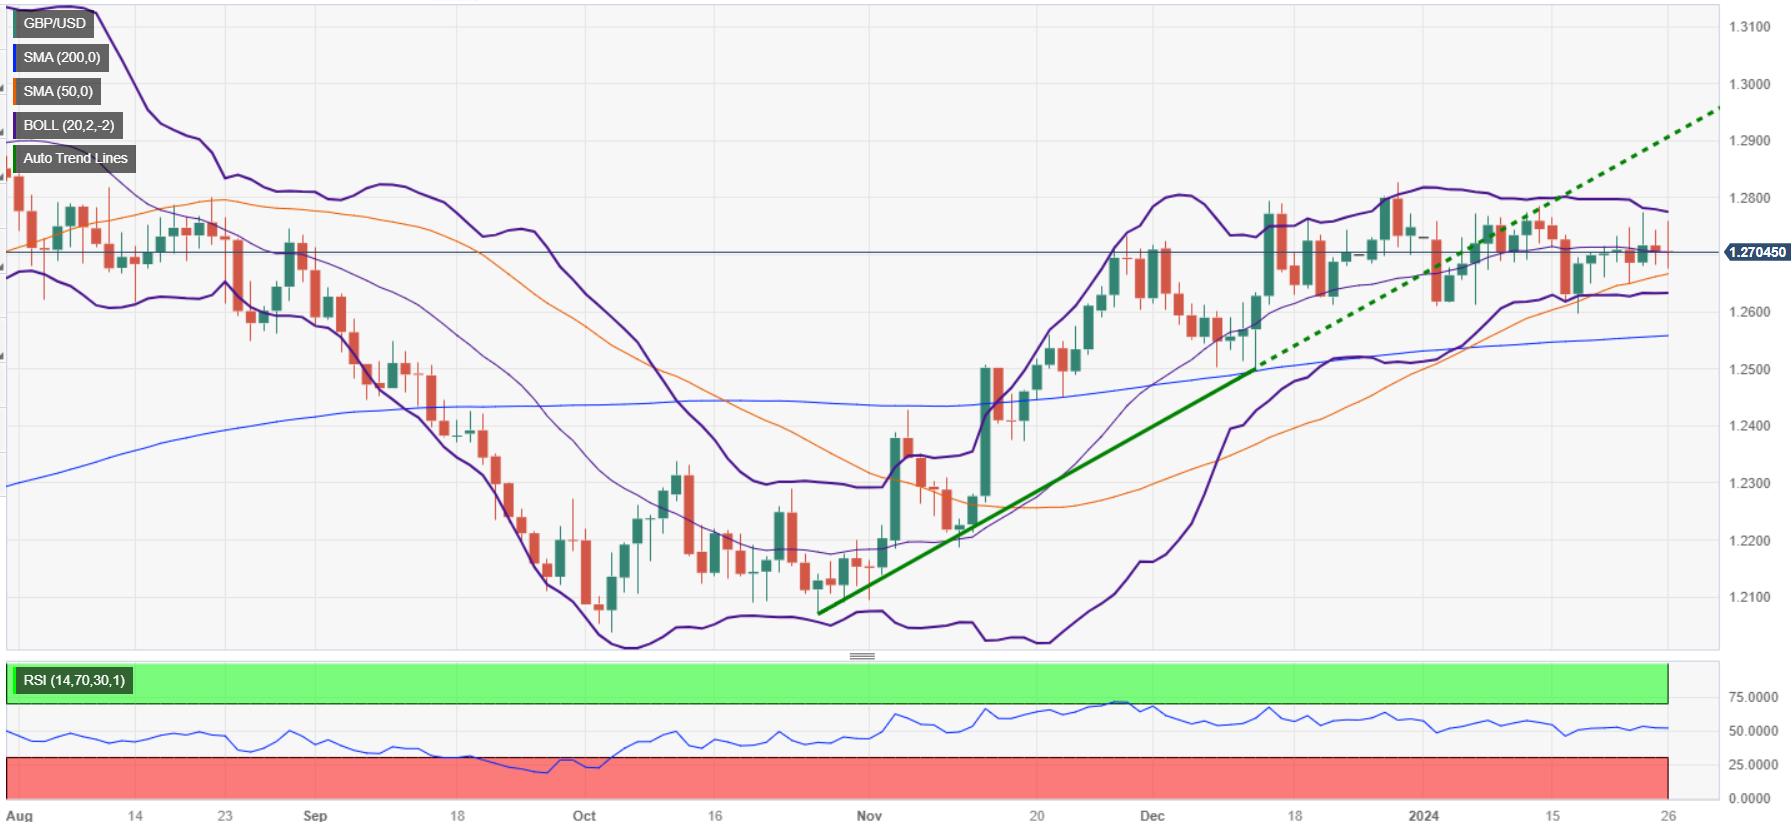
GBP/USD Price Analysis: Technical Outlook
From a technical point of view, GBP/USD maintains a neutral bias, although it is believed that it could tilt lower, as the price action approaches the 50-day moving average (DMA), the first level of support at 1.2654. If sellers break below 1.2700 and 1.2654, further declines will be seen. The next demand zone would be the January 5 low at 1.2611 and 1.2600. To the upside, the pair's first resistance would be the January 24 cycle high at 1.2774, before testing 1.2800.
Source: Fx Street
I am Joshua Winder, a senior-level journalist and editor at World Stock Market. I specialize in covering news related to the stock market and economic trends. With more than 8 years of experience in this field, I have become an expert in financial reporting.


