
- GBP/USD is holding above 1.3100, with the RSI showing buyers in control and targeting the 1.3200 resistance.
- Breaking above 1.3179 would open the door to challenge the March 2022 high of 1.3298, with further upside to 1.3437.
- A drop below 1.3150 could lead to a test of key support at 1.3100 and 1.3044, with the 50-day SMA at 1.2914.
GBP/USD is pointing higher during the North American session after the US employment data was mixed, while business activity expanded. Despite this, the pair is holding on to its gains and is trading at 1.3166, up from its opening price by 0.15% at the time of writing.
GBP/USD Price Forecast: Technical Outlook
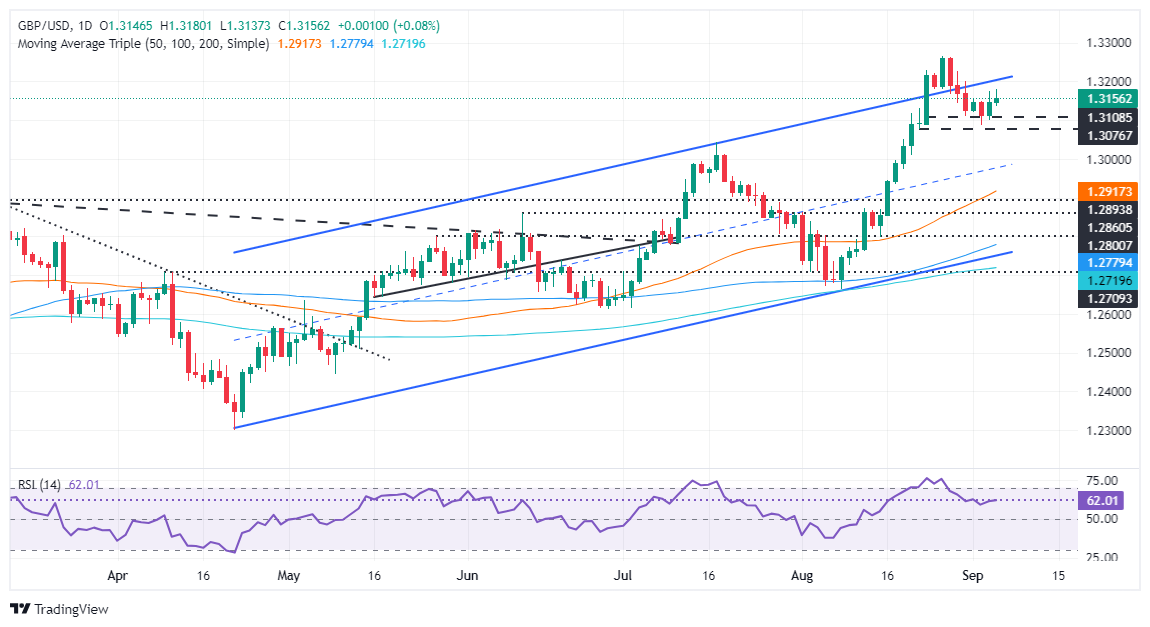
GBP/USD has held above the 1.3100 figure but has been limited on the upside so far as traders await the release of August Non-Farm Payrolls on Friday. The Relative Strength Index (RSI) shows that buyers are in charge and could sponsor a move towards 1.3200.
If GBP/USD resumes the uptrend and breaks above 1.3179, a move towards 1.3200 will be on the cards. A break of the latter will expose the March 23, 2022 peak at 1.3298 before challenging the March 1, 2022 cycle high at 1.3437.
Conversely, if sellers step in and push GBP/USD below 1.3150, look for a pullback to 1.3100. Despite this, bears need to overcome the September 3 low of 1.3087 if they want to maintain hope for lower exchange rates. The next key support levels would be the July 17 high at 1.3044, followed by the 1.3000 figure and the 50-day moving average (DMA) at 1.2914.
GBP/USD Price Action – Daily Chart
Pound Sterling PRICE Today
The table below shows the exchange rate of the British Pound (GBP) against major currencies today. The British Pound was the strongest currency against the Swiss Franc.
| USD | EUR | GBP | JPY | CAD | AUD | NZD | CHF | |
|---|---|---|---|---|---|---|---|---|
| USD | 0.03% | -0.09% | 0.14% | 0.06% | 0.04% | -0.11% | 0.22% | |
| EUR | -0.03% | -0.10% | 0.16% | 0.06% | 0.01% | -0.09% | 0.19% | |
| GBP | 0.09% | 0.10% | 0.23% | 0.17% | 0.11% | 0.00% | 0.29% | |
| JPY | -0.14% | -0.16% | -0.23% | -0.09% | -0.13% | -0.27% | 0.06% | |
| CAD | -0.06% | -0.06% | -0.17% | 0.09% | -0.02% | -0.16% | 0.14% | |
| AUD | -0.04% | -0.01% | -0.11% | 0.13% | 0.02% | -0.12% | 0.18% | |
| NZD | 0.11% | 0.09% | -0.01% | 0.27% | 0.16% | 0.12% | 0.30% | |
| CHF | -0.22% | -0.19% | -0.29% | -0.06% | -0.14% | -0.18% | -0.30% |
The heatmap shows percentage changes of major currencies. The base currency is selected from the left column, while the quote currency is selected from the top row. For example, if you choose the British Pound from the left column and move along the horizontal line to the US Dollar, the percentage change shown in the chart will represent the GBP (base)/USD (quote).
Source: Fx Street
I am Joshua Winder, a senior-level journalist and editor at World Stock Market. I specialize in covering news related to the stock market and economic trends. With more than 8 years of experience in this field, I have become an expert in financial reporting.


