
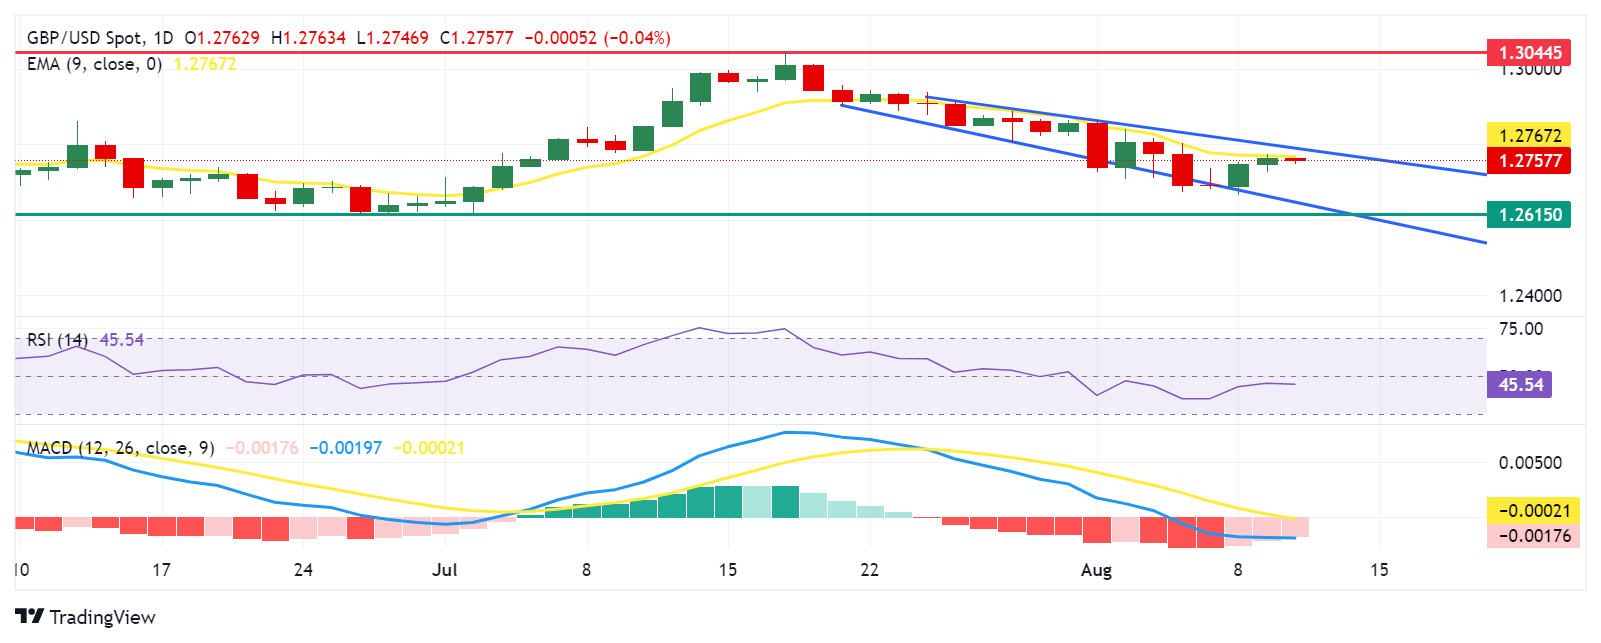
- GBP/USD could test the immediate barrier at the nine-day EMA of 1.2767 and the upper boundary around the 1.2800 level.
- Technical analysis on the daily chart suggests a bearish bias for the pair.
- The lower border of the descending channel around the 1.2650 level could act as a key support.
GBP/USD pauses its two-day advance, trading around 1.2760 during the Asian session on Monday. The daily chart analysis shows that the pair is consolidating within a descending channel, indicating a bearish bias.
The Moving Average Convergence/Divergence (MACD) indicator is suggesting bearish momentum as the MACD line is below both the signal line and the center line. Additionally, the 14-day Relative Strength Index (RSI) is holding below the 50 level, reinforcing the bearish outlook.
As for resistance, the pair faces an immediate barrier around the nine-day exponential moving average (EMA) at the level of 1.2767, followed by the upper boundary around the level of 1.2800. A break above this level could propel GBP/USD towards the yearly high of 1.3044, reached on July 17.
On the downside, GBP/USD could test the key support at the lower border of the descending channel around the 1.2650 level. A break below this level could increase the downward pressure, potentially guiding the pair towards the retracement support at the 1.2615 level, seen in June.
GBP/USD: Daily Chart
Pound Sterling PRICE Today
The table below shows the exchange rate of the British Pound (GBP) against major currencies today. The British Pound was the weakest currency against the Australian Dollar.
| USD | EUR | GBP | JPY | CAD | AUD | NZD | CHF | |
|---|---|---|---|---|---|---|---|---|
| USD | -0.01% | 0.01% | 0.34% | -0.02% | -0.10% | -0.16% | 0.15% | |
| EUR | 0.00% | 0.04% | 0.32% | -0.02% | -0.22% | -0.16% | 0.17% | |
| GBP | -0.01% | -0.04% | 0.54% | -0.06% | -0.26% | -0.21% | 0.13% | |
| JPY | -0.34% | -0.32% | -0.54% | -0.34% | -0.51% | -0.50% | -0.21% | |
| CAD | 0.02% | 0.02% | 0.06% | 0.34% | -0.14% | -0.14% | 0.20% | |
| AUD | 0.10% | 0.22% | 0.26% | 0.51% | 0.14% | 0.06% | 0.39% | |
| NZD | 0.16% | 0.16% | 0.21% | 0.50% | 0.14% | -0.06% | 0.33% | |
| CHF | -0.15% | -0.17% | -0.13% | 0.21% | -0.20% | -0.39% | -0.33% |
The heatmap shows percentage changes of major currencies. The base currency is selected from the left column, while the quote currency is selected from the top row. For example, if you choose the British Pound from the left column and move along the horizontal line to the US Dollar, the percentage change shown in the chart will represent the GBP (base)/USD (quote).
Source: Fx Street
I am Joshua Winder, a senior-level journalist and editor at World Stock Market. I specialize in covering news related to the stock market and economic trends. With more than 8 years of experience in this field, I have become an expert in financial reporting.


