
- GBP/USD pulls back on Tuesday, halting a two-day rally from a multi-week low.
- Dovish Fed expectations and recession fears benefit the safe-haven USD and put some pressure on the pair.
- The technical situation favors the bears and supports prospects for further decline.
GBP/USD comes under some selling pressure on Tuesday and halts its recent rally from the 1.1915 zone, the lowest since January 6 hit last week. The pair remains on the defensive during the early stages of the European session, although it manages to stay above the psychological level of 1.2000, at least for the moment.
The dollar continues to be supported by rising expectations of further monetary policy tightening by the Fed and looming recession risks. Apart from this, speculation that the current Bank of England (BoE) rate hike cycle may be coming to an end is weighing on sterling and contributing to a slightly selling tone around GBP/USD.
However, the downside remains subdued as traders seem reluctant to open aggressive directional positions ahead of the release of the latest FOMC meeting minutes on Wednesday. Ahead of the key event, the preliminary version of the UK and US PMIs could lead to short-term opportunities around the GBP/USD pair on Tuesday.
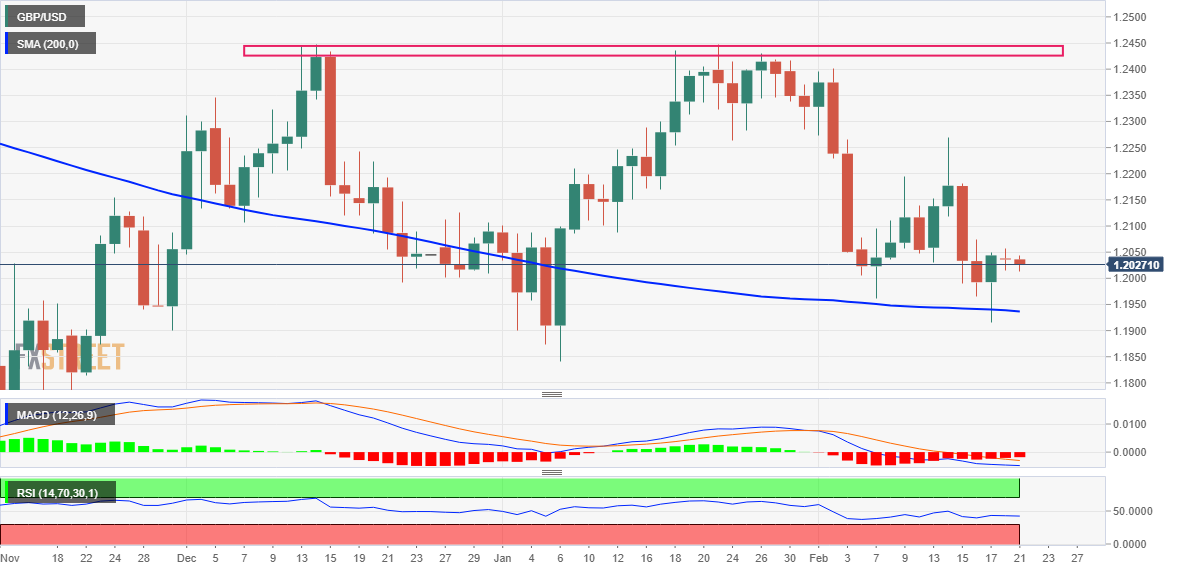
From a technical perspective, any further decline is likely to find decent support near the very important 200-day SMA, currently around the 1.1935 region. This is closely followed by last Friday’s low around the 1.1915 area and the round 1.1900 level, which if broken decisively should pave the way for another move lower.
Against the background of the recent failures near the 1.2450 zone, which constitute the formation of a bearish double top pattern, the fall will mark a new breakout. The GBP/USD pair could then accelerate the decline towards the yearly low, around the 1.1840 zone touched in January, and prolong the bearish movement towards the round level of 1.1800.
On the other hand, the 1.2050-1.2055 zone seems to have become an immediate hurdle. It is followed by the 1.2070-1.2075 resistance zone and the 1.2100 level. If this latter zone is broken, GBP/USD could break the 1.2130-1.2135 barrier and approach the 50-day SMA, currently around the 1.2170 zone.
This last level should act as a pivot point, which if broken decisively could trigger a short-term rally. GBP/USD could then recapture the round 1.2200 level and continue to rally to last week’s high around the 1.2265-1.2270 area before trying to recapture the 1.2300 level.
GBP/USD daily chart
GBP/USD additional technical levels
Source: Fx Street
I am Joshua Winder, a senior-level journalist and editor at World Stock Market. I specialize in covering news related to the stock market and economic trends. With more than 8 years of experience in this field, I have become an expert in financial reporting.


