
- The GBP/USD pair drops 0.04% and reaches a maximum of 1.2746 in early North American operations.
- The technical data shows a bearish trend with a “shooting star” pattern and selling momentum.
- Support at the May 21 low at 1.2686, the May 16 low at 1.2643 and the psychological level of 1.2600.
- Resistance at 50-hour SMA (1.2721), 100-hour SMA (1.2712), weekly high 1.2761; potential target at 1.2800.
Early in the North American session, the British pound fell against the dollar after data from the United States showed a rebound in business activity. At the same time, inflationary pressures increased, triggering investor fears that the Fed would delay rate cuts throughout the year. GBP/USD is trading at 1.2711 after hitting a high of 1.2746, down 0.04%
GBP/USD Price Analysis: Technical Insights
GBP/USD is trading lower after a “shooting star” pattern on Wednesday, a prelude to lower prices. Today's price action witnessed a jump towards a high of 1.2750, but it still failed to surpass the current week's high of 1.2761, opening the door for further losses.
In the short term, the one-hour GBP/USD chart suggests that the pair is range-bound, capped to the upside by the 50-hour SMA at 1.2721 and the 100-hour SMA at 1.2712. However, the momentum supports the sellers, as shown by the RSI, which remains bearish and is at its lowest level since May 17.
Therefore, if the pair falls below 1.2700, the next support would be the May 21 low at 1.2686, followed by the May 16 low at 1.2643 and the psychological mark of 1.2600.
Conversely, if buyers push the exchange rate above 1.2746, the weekly high of 1.2761 would be tested. If the pair strengthens further, it could target 1.2800.
GBP/USD Price Action – Hourly Chart
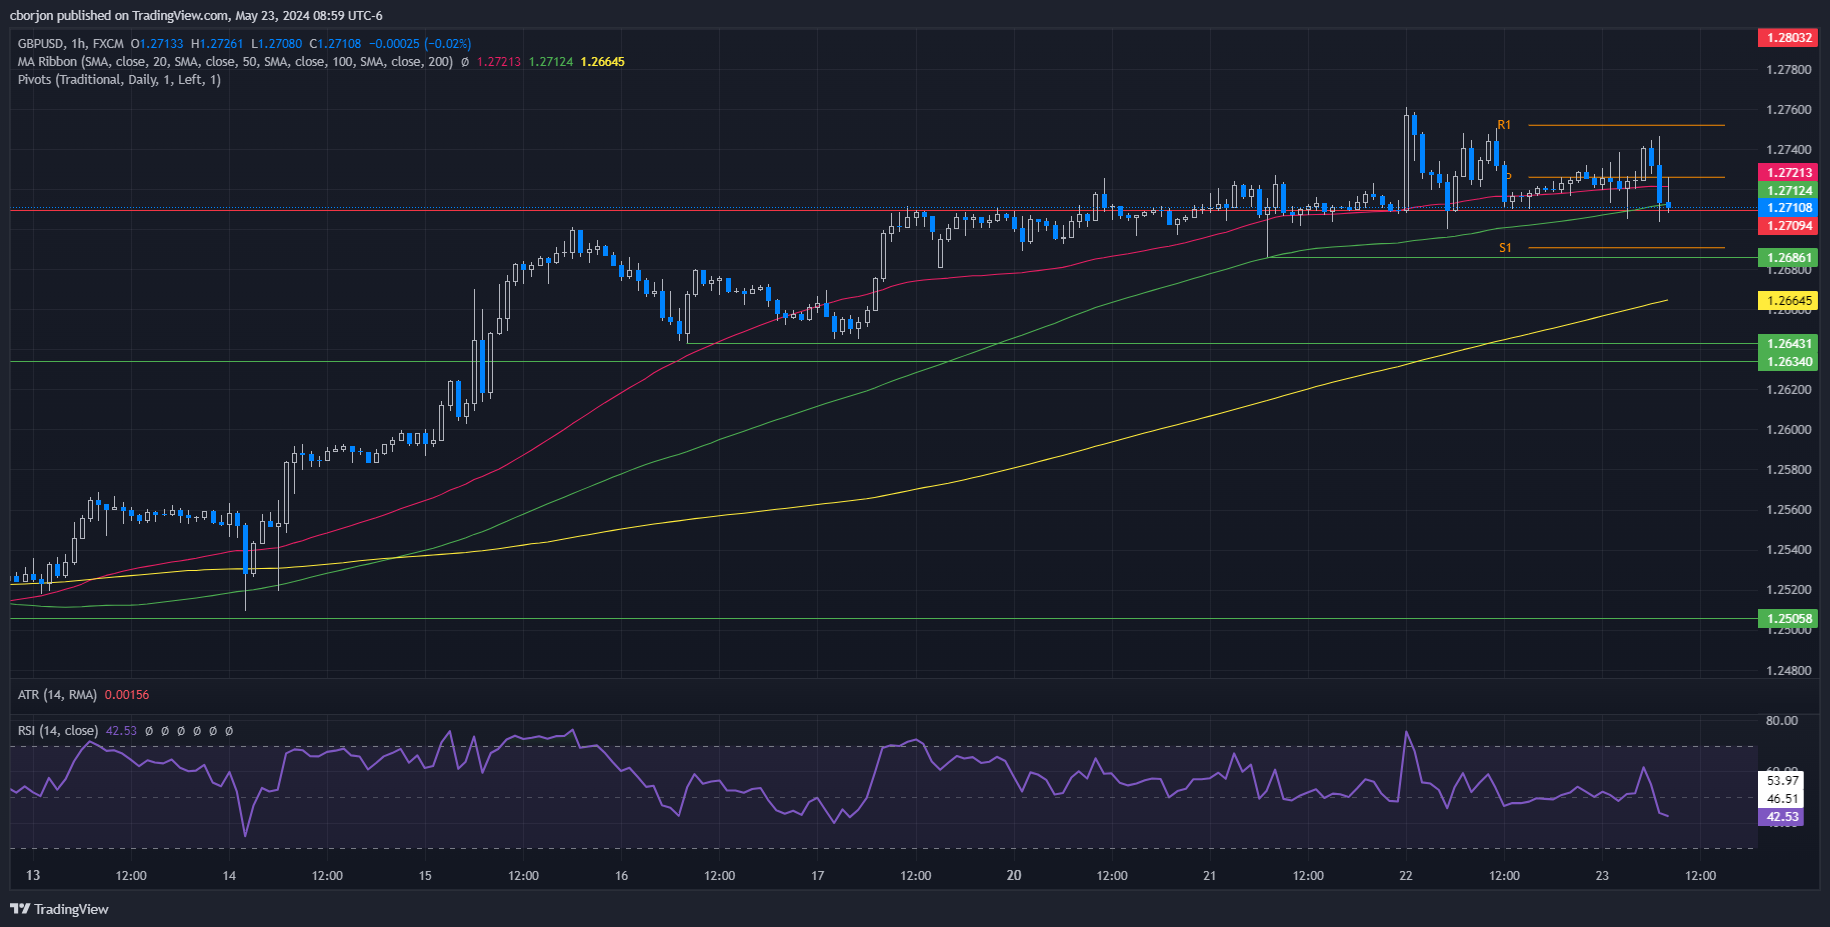
Source: Fx Street
I am Joshua Winder, a senior-level journalist and editor at World Stock Market. I specialize in covering news related to the stock market and economic trends. With more than 8 years of experience in this field, I have become an expert in financial reporting.


