
- GBP/USD posts minuscule losses of 0.05% on Thursday.
- The rebound in US producer prices and strong labor market data should keep the Fed tightening monetary policy.
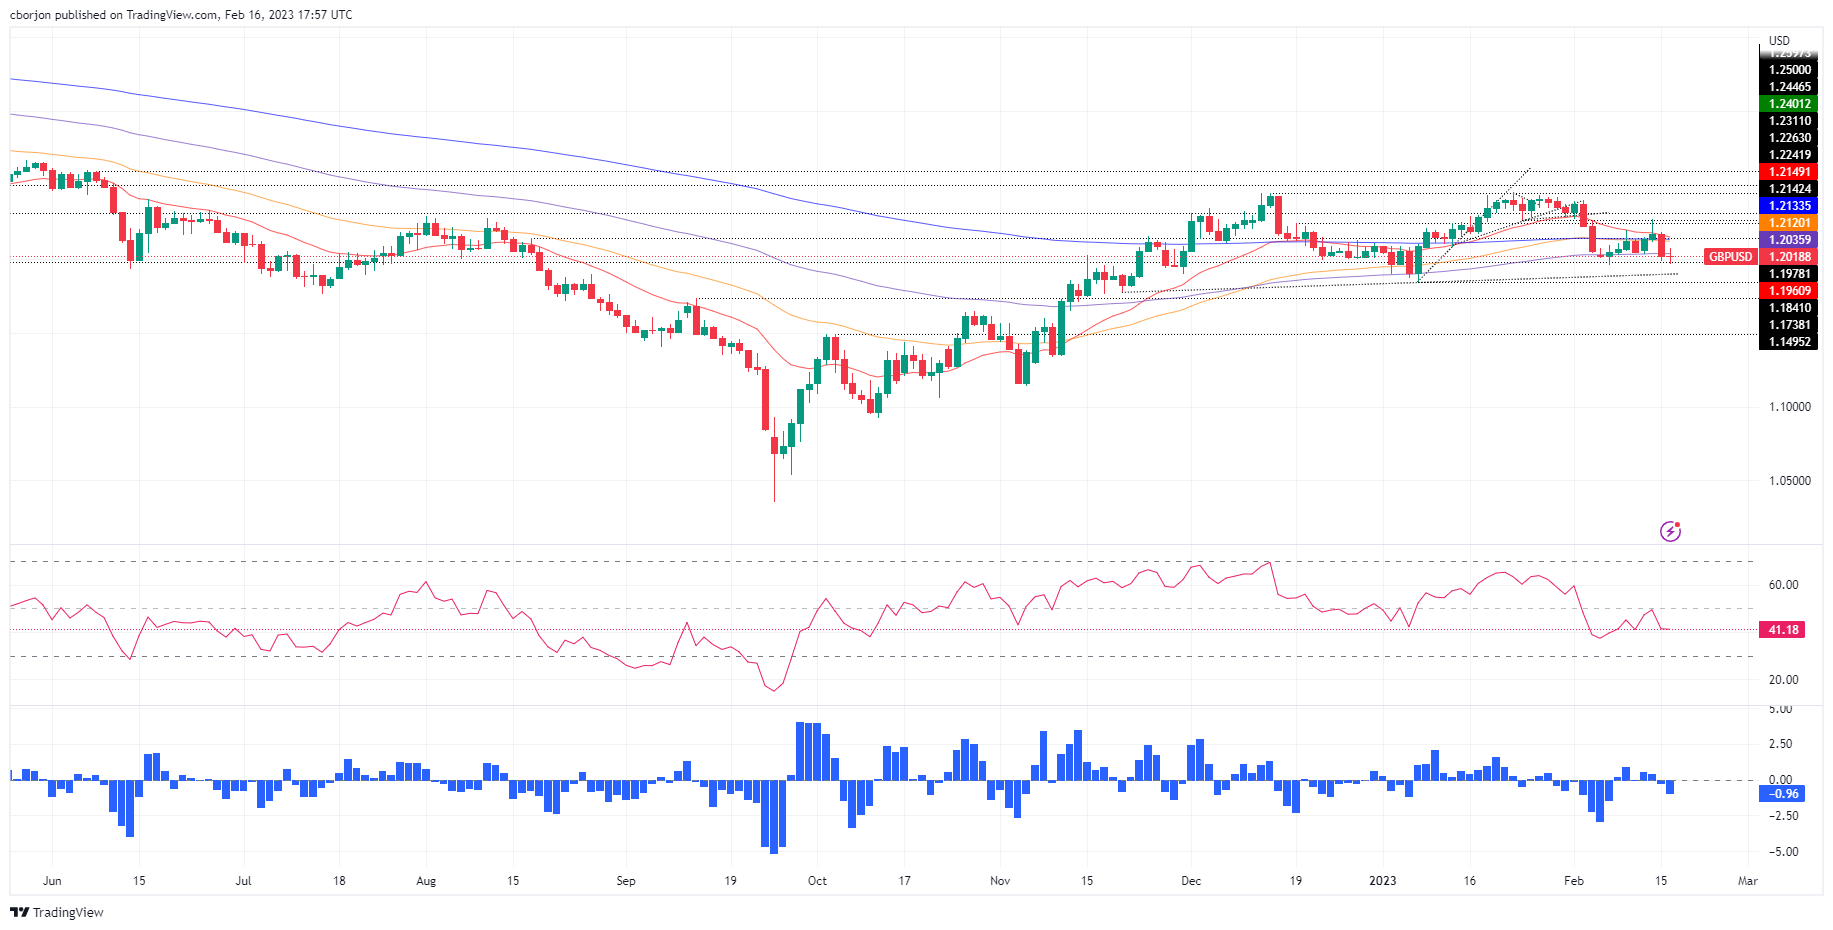
- GBP/USD Price Analysis: A daily close below the 100 day EMA will cement the downside bias.
The pair GBP/USD It remains downward in the North American mid-session driven by a rebound in producer inflation in the United States (USA). By contrast, UK inflation data on Wednesday weakened the British pound (GBP) due to slowing inflation. Hence, the GBP/USD pair is trading around the 1.2000/15 range, below its opening price.
US PPI rebound and labor market tightness likely to put pressure on Fed
The US Bureau of Labor Statistics (BLS) revealed that the Producer Price Index in January increased by 0.7% compared to December, above the expected jump of 0.4%. Excluding items prone to rapid price changes, the so-called core PPI rose 0.5% versus an estimated 0.3% increase. Although the year-on-year data was lower than the previous month, the monthly figures indicate that inflation is persistently high and may require additional measures by the Federal Reserve to tackle it.
Following the data release, GBP/USD declined from the vicinity of the daily pivot point of 1.2060 and fell towards the 1.1978 zone before recovering the 1.2000 figure.
At the same time, initial claims for jobless benefits for the week ending February 11 stood at 194,000, down from the previous reading of 196,000, and showed the resiliency of the labor market. Although high-tech companies announced layoffs, lower jobless claims numbers would put pressure on the Federal Reserve, and could open the door for further tightening than anticipated.
Meanwhile, the Philadelphia Fed’s manufacturing index fell sharply to -24.3 versus -7.4 estimated by analysts. The survey collected the comments of the producers, who affirmed that the prices of inputs are rising after ten months of cooling.
On the other hand, the softer UK Consumer Price Index (CPI) was released, which fell to 10.1% from 10.5% in December, on an annual basis. UK bond yields fell following the data release, reflecting that the Bank of England (BoE) would not need to aggressively tighten monetary conditions.
Against this backdrop, GBP/USD could extend its losses on recent data from the United States (US), which would trigger a Fed reaction. Money market futures forecast at least two rate hikes interest of 25 basis points, which would raise the federal funds rate (FFR) to the range of 5-5.25%. That being said, further falls are expected for GBP/USD, with sellers already dragging prices below the 20, 50 and 100 day EMAs.
GBP/USD Technical Analysis
The GBP/USD daily chart shows the pair with a neutral to bearish bias. On Thursday, the sellers pushed the exchange rate to close below the 100-day EMA at 1.2035. This would consolidate the downtrend and uncover the 1.2000 level, followed by the February low at 1.1960 and the psychological level of 1.1900. As an alternate scenario, if GBP/USD recaptures the 100 day EMA, it could pave the way towards 1.2100.
Source: Fx Street
I am Joshua Winder, a senior-level journalist and editor at World Stock Market. I specialize in covering news related to the stock market and economic trends. With more than 8 years of experience in this field, I have become an expert in financial reporting.


