
- The Fed’s favorite inflation gauge signals cumulative tightening continues to hold back inflation.
- The University of Michigan Consumer Sentiment was worse than expected, although inflation expectations cooled.
- GBP/USD Price Analysis: Above 1.2400 could challenge year-over-year high; otherwise it would stay sideways around 1.2300-1.2400.
The British pound (GBP) traded with decent losses in the middle of the North American session, pressured by the revival of the US dollar (USD), which pared Thursday’s losses. Despite the fact that the inflation data could cause a change in the policy position of the US Federal Reserve (Fed), market participants buy dollars in view of the proximity of the weekly, monthly and quarterly close. At the time of writing these lines, the GBP/USD pair is trading at 1.2331.
US inflation down, though Fed officials remain steadfast in fighting inflation
US economic data from the Commerce Department revealed that the Fed’s favorite inflation gauge, core PCE, rose 4.6% yoy, below forecasts and 4.7% the previous month. Headline inflation was 5%, down from 5.3% in January, a sign that the accumulated tightening by the Fed continues to moderate inflation.
Boston Fed President Susan Collins welcomed the news, but reiterated that the Fed has work to do. New York Fed President John Williams will speak later.
As for other data, the University of Michigan (UM) showed that consumer sentiment in its final reading for March was 62, worse than expected. At the same time, inflation expectations fell. For the one-year horizon, the estimated inflation rate is 3.6%, while for the 5-year horizon, consumers estimate inflation to be 2.9%.
Following the release of US inflation data, GBP/USD hovered around 1.2400 before slumping below the central pivot point at 1.2357 and extending its losses towards the 1.2340 area. However, the bullish correction was capped at this point, and GBP/USD resumed its bearish trajectory, with its sights set on a test of the S1 pivot at 1.2320.
In the UK, the economy grew by 0.1% in the fourth quarter of 2022 and 0.6% year-on-year, according to data from the Office for National Statistics (ONS).
GBP/USD Technical Analysis
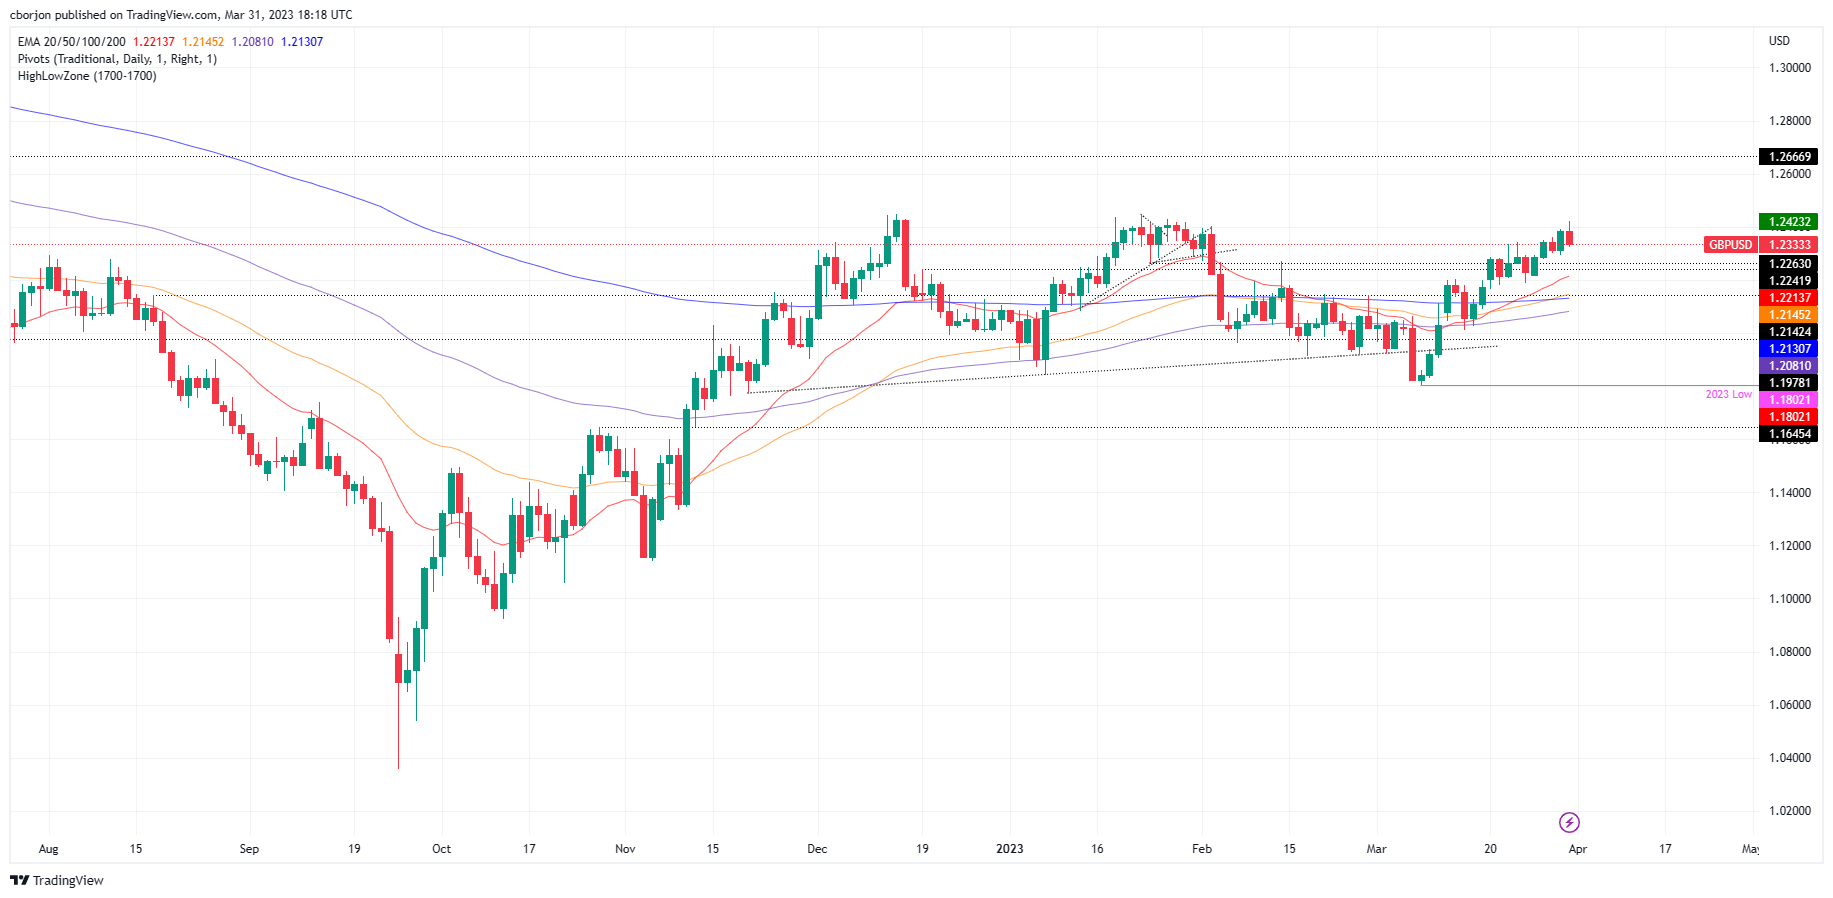
From a daily chart standpoint, GBP/USD would continue to trade sideways after dipping below 1.2400. However, GBP/USD could consolidate in the 1.2300-1.2400 zone before extending its recovery beyond this year’s high of 1.2423. This would pave the way towards 1.2500, with risks to the upside at the May 27 high of 1.2666. Otherwise, if GBP/USD were to close around 1.2300, a bearish engulfing candle would form, setting up major currencies for a pullback towards the 20-day SMA at 1.2213.
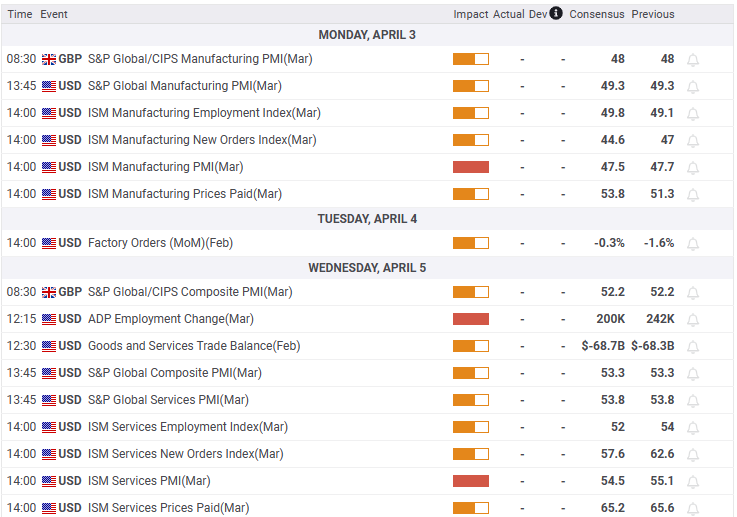
What is there to watch out for?
Source: Fx Street
I am Joshua Winder, a senior-level journalist and editor at World Stock Market. I specialize in covering news related to the stock market and economic trends. With more than 8 years of experience in this field, I have become an expert in financial reporting.


