
- GBP/JPY erases part of its gains and ends the week with more than 3% gains.
- GBP/JPY traders mostly ignored the UK political turmoil.
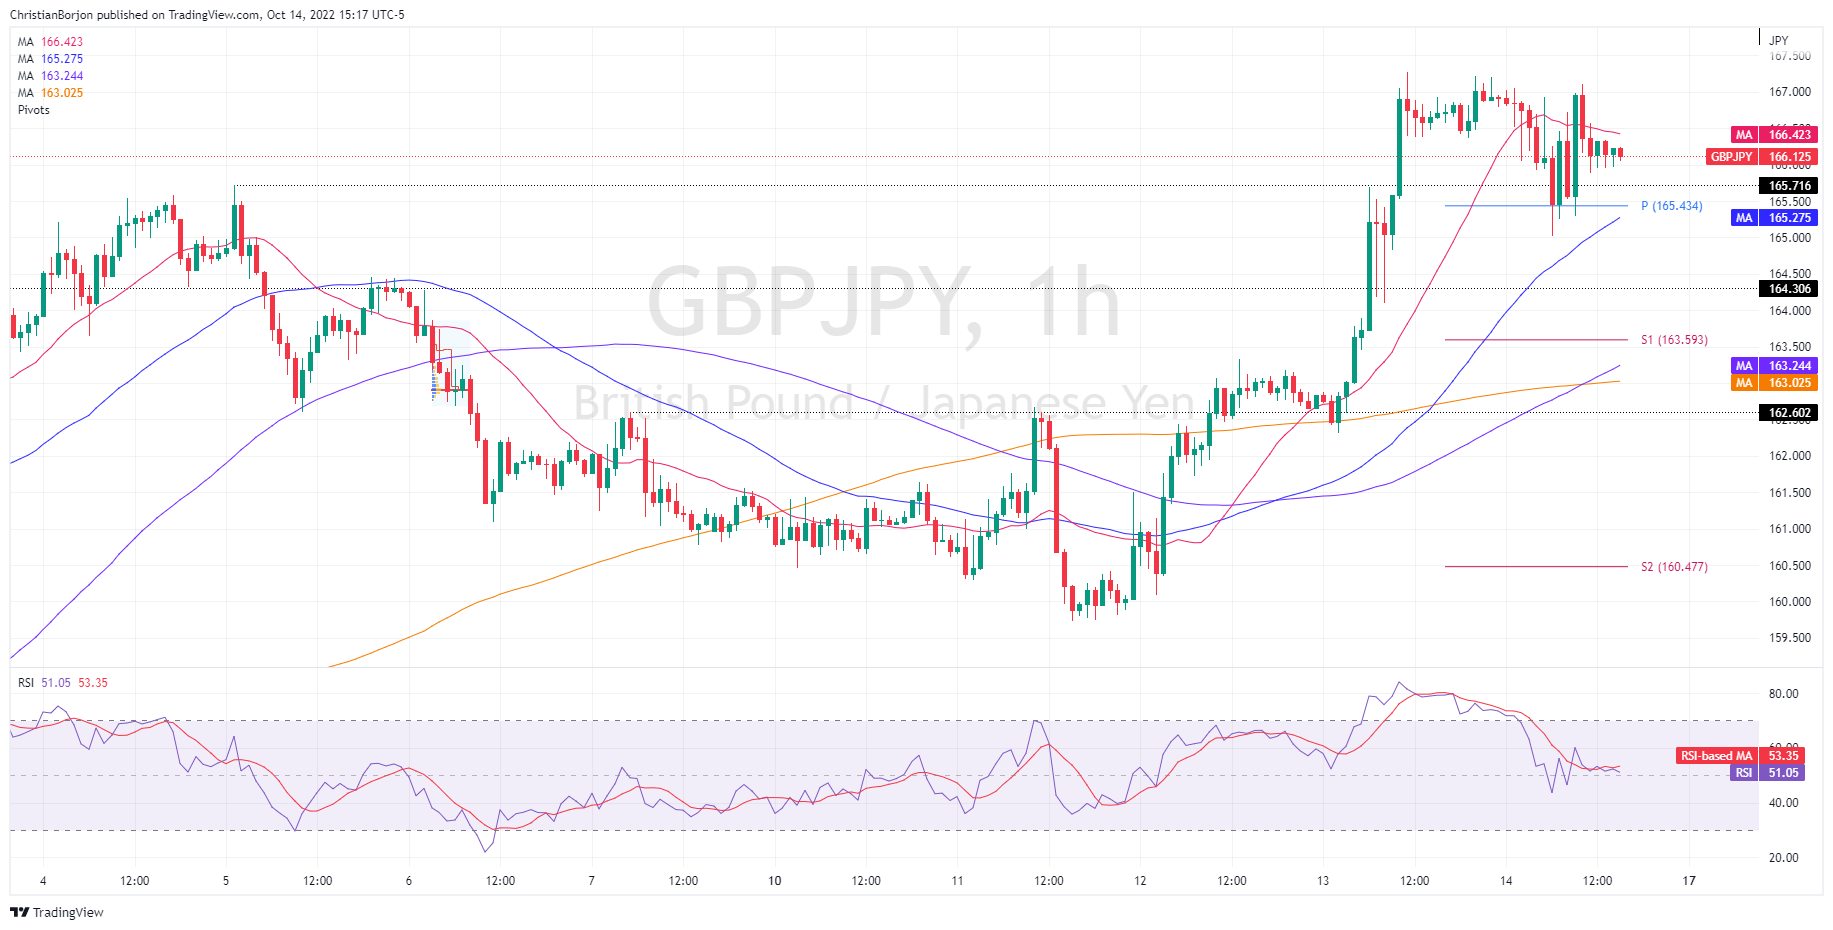
- The currency cross is in a range as the one hour chart shows.
The GBP/JPY trims some of Thursday’s losses but remains near weekly highs around 166.00 area, despite UK political turmoil weighing on GBP/USD, GBP/JPY continues to hold gains due to the dovish stance of the Bank of Japan. GBP/JPY is therefore trading at 166.16, down 0.33% from its opening price.
GBP/JPY Price Forecast
The GBP/JPY daily chart was flat compared to Thursday, although it is worth noting that the exchange rate is above the 5th Oct high of 165.71 which could keep GBP/JPY trading within from the range of 165.71-167.27. Oscillators remain in positive territory, keeping the neutral-upward bias intact, although a break above 167.27 would pave the way towards 167.94, before challenging the all-time high at 168.73.
The GBP/JPY one hour scale shows that the pair is consolidating between the 20 and 50 EMAs, while the Relative Strength Index (RSI) is almost flat but in bullish territory. To the upside, the first resistance would be the 20 EMA at 166.42, followed by the daily high at 167.21, before 168.00.
On the other hand, the first support for the GBP/JPY would be the daily pivot at 165.45, immediately followed by the 50 EMA at 165.27. Once past that 18 point zone, GBP/JPY could drop to the 165.00 zone, followed by the S1 pivot at 163.59.
GBP/JPY Key Technical Levels
Source: Fx Street
With 6 years of experience, I bring to the table captivating and informative writing in the world news category. My expertise covers a range of industries, including tourism, technology, forex and stocks. From brief social media posts to in-depth articles, I am dedicated to creating compelling content for various platforms.


.jpg "It’s official: Peppa Pig will have a little sister")


