
- GBP/JPY's bullish move takes the pair to its highest bids since 2015.
- The technical ceiling is near 196.00, at the June 2015 high.
- Japan's national CPI will be released early Tuesday and is expected to decline further.
The GBP/JPY cross is up over 6% in 2024 as the pair continues to rise to multi-year highs, reaching its highest bids since August 2015 just above the 191.00 zone.
Some UK economic data will be released this week, but it will be of little relevance. Japan's national Consumer Price Index (CPI) inflation figures will be released early on Tuesday, while Japanese Retail Trade figures will be released on Thursday.
Japan's national CPI for the year ended January is expected to reiterate the results of Tokyo's flash CPI, as Japanese inflation continues to cool. The core national CPI is expected to decline to 1.8% year-on-year from 2.3% in the previous period.
Early Thursday, Japan's retail trade is expected to rebound to 2.3% year-on-year from 2.1% previously, but January Industrial production is forecast to fall sharply by 7.4% from a 1.4% rise in the previous month.
GBP/JPY is rapidly approaching 2015 bid highs near 196.00, with prices above the 200.00 main price level awaiting beyond. GBP/JPY has not traded above 200.00 since 2008.
GBP/JPY is up more than 3% from February bid lows at 185.23, and the pair is approaching multi-year highs that leave the cross with few technical barriers as the march up the charts continues. .
A short-term supply zone is marked between 190.50 and the 190.00 level, and 190.00 remains a key technical barrier having previously capped intraday chart action following February's previous rejection from the key level.
GBP/JPY has rebounded in 2024, rising from January's initial low at 178.74, managing a bullish bounce off the 200-day SMA in the process, which is currently rising through the 183.00 zone.
GBP/JPY hourly chart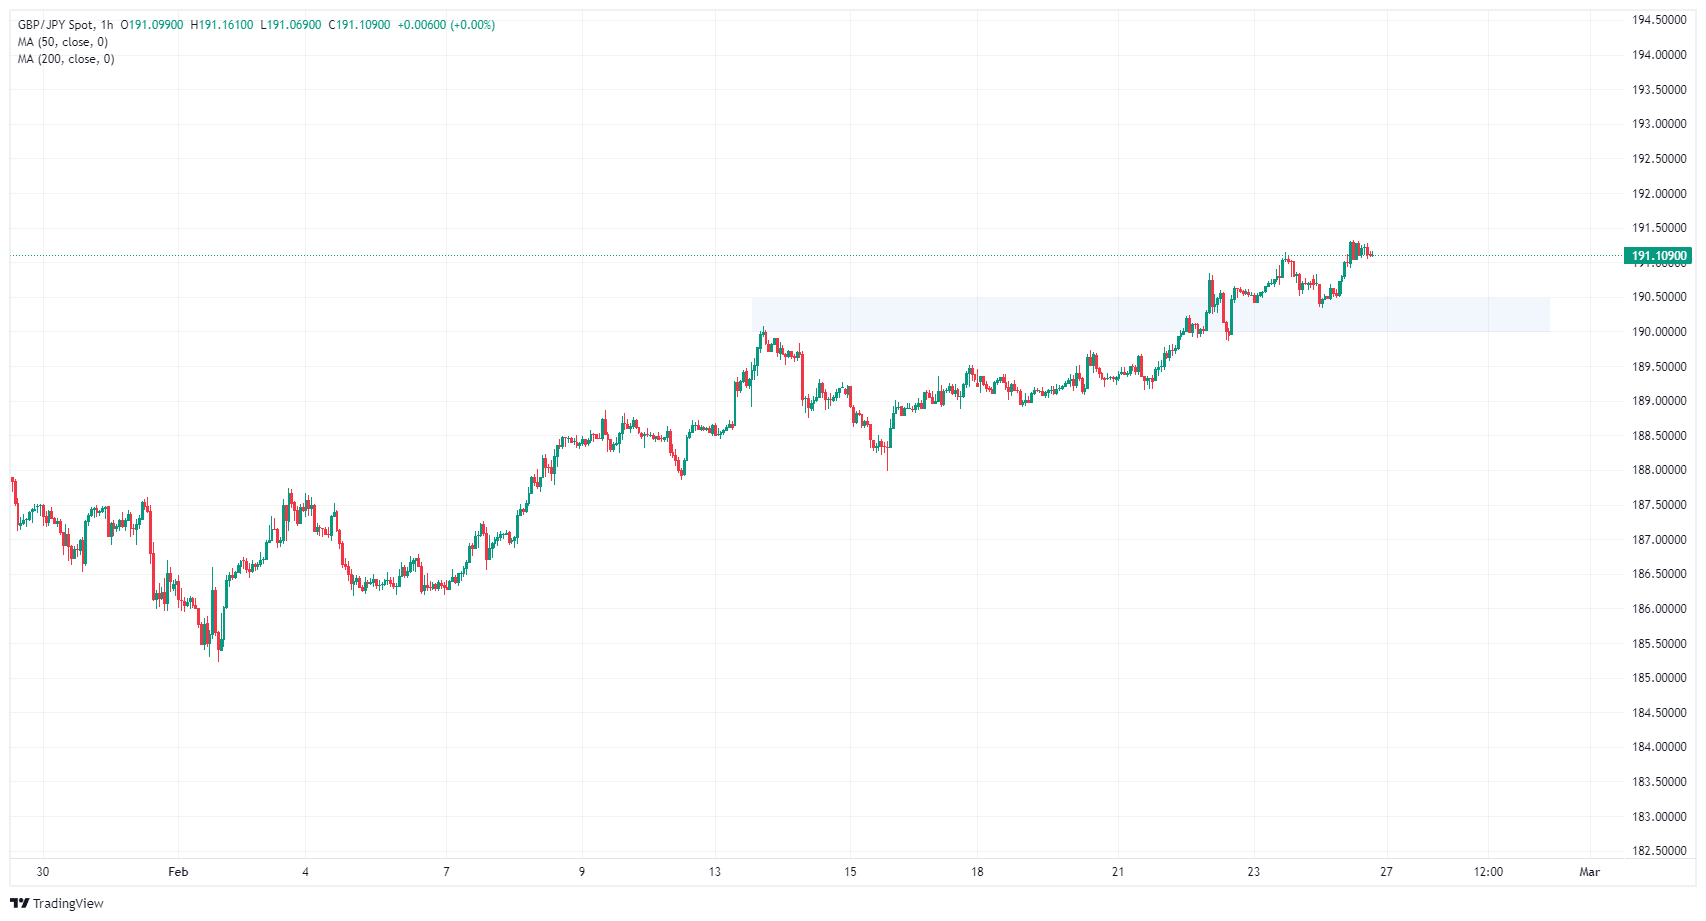
GBP/JPY daily chart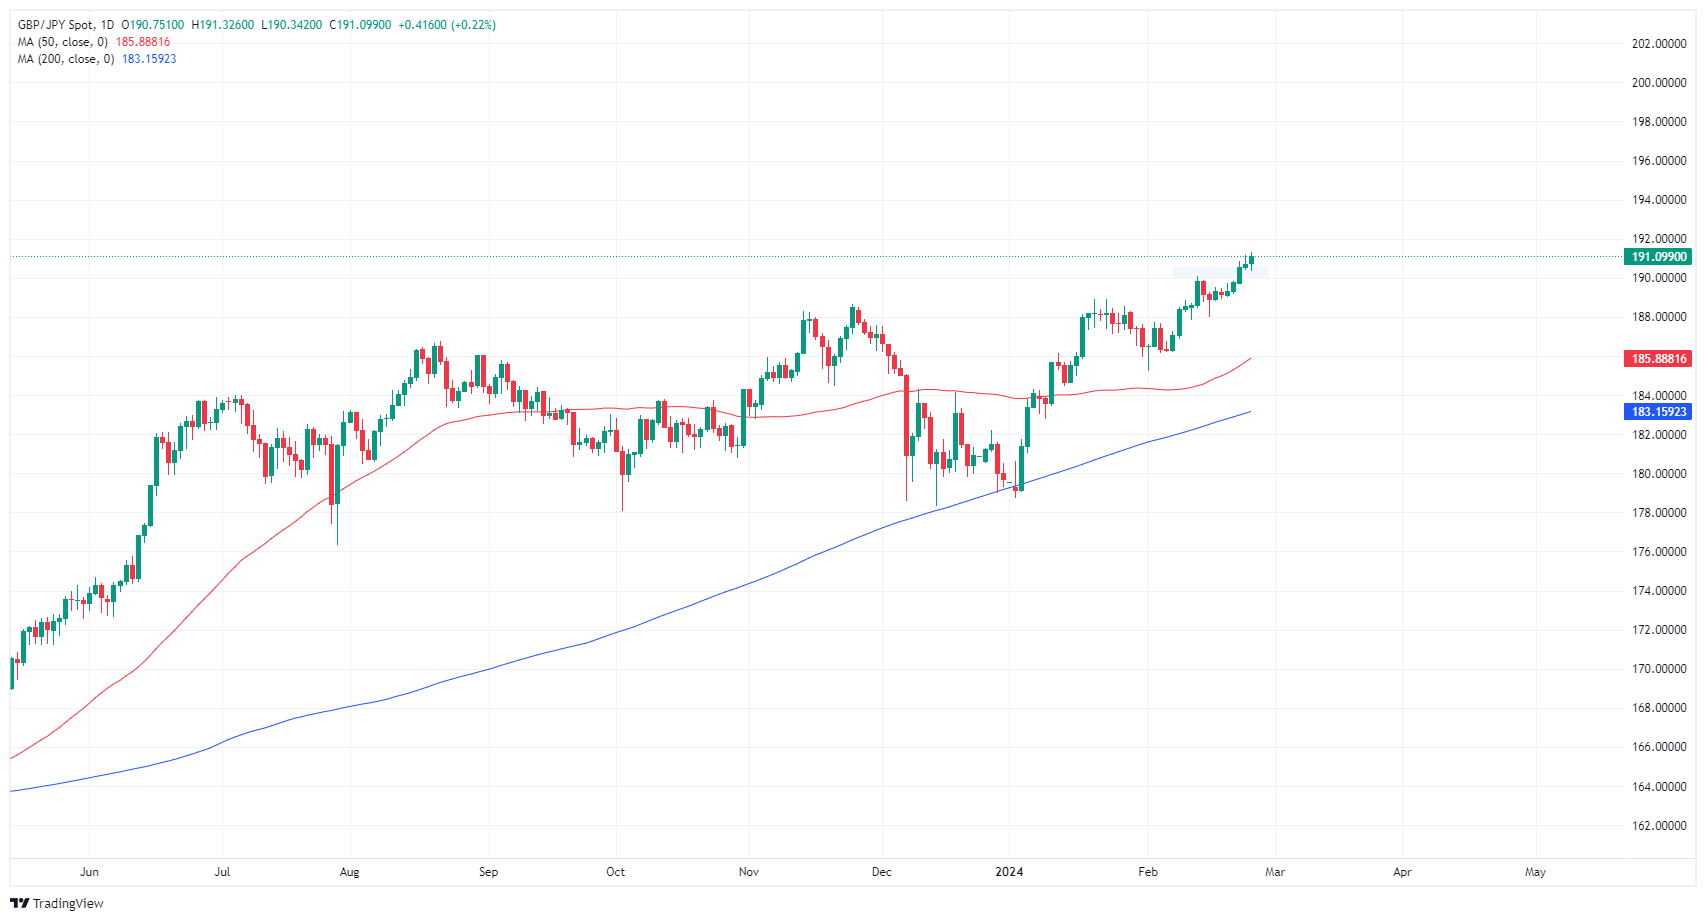
Source: Fx Street
I am Joshua Winder, a senior-level journalist and editor at World Stock Market. I specialize in covering news related to the stock market and economic trends. With more than 8 years of experience in this field, I have become an expert in financial reporting.


