
- GBP/CAD returns to the bottom of a trend line that it has broken below.
- The pair is consolidating after falling within an ascending channel.
GBP/CAD is pulling back after developing a partial bearish leg within a broader ascending channel. It is probably in a short-term downtrend, which, given the “trend is your friend” principle, favors marginally further to the downside.
The pair broke below a major trend line (“Trend Line A” on the chart) on October 3. It then bottomed and has since recovered to the bottom of the trend line.
GBP/CAD 4-hour chart
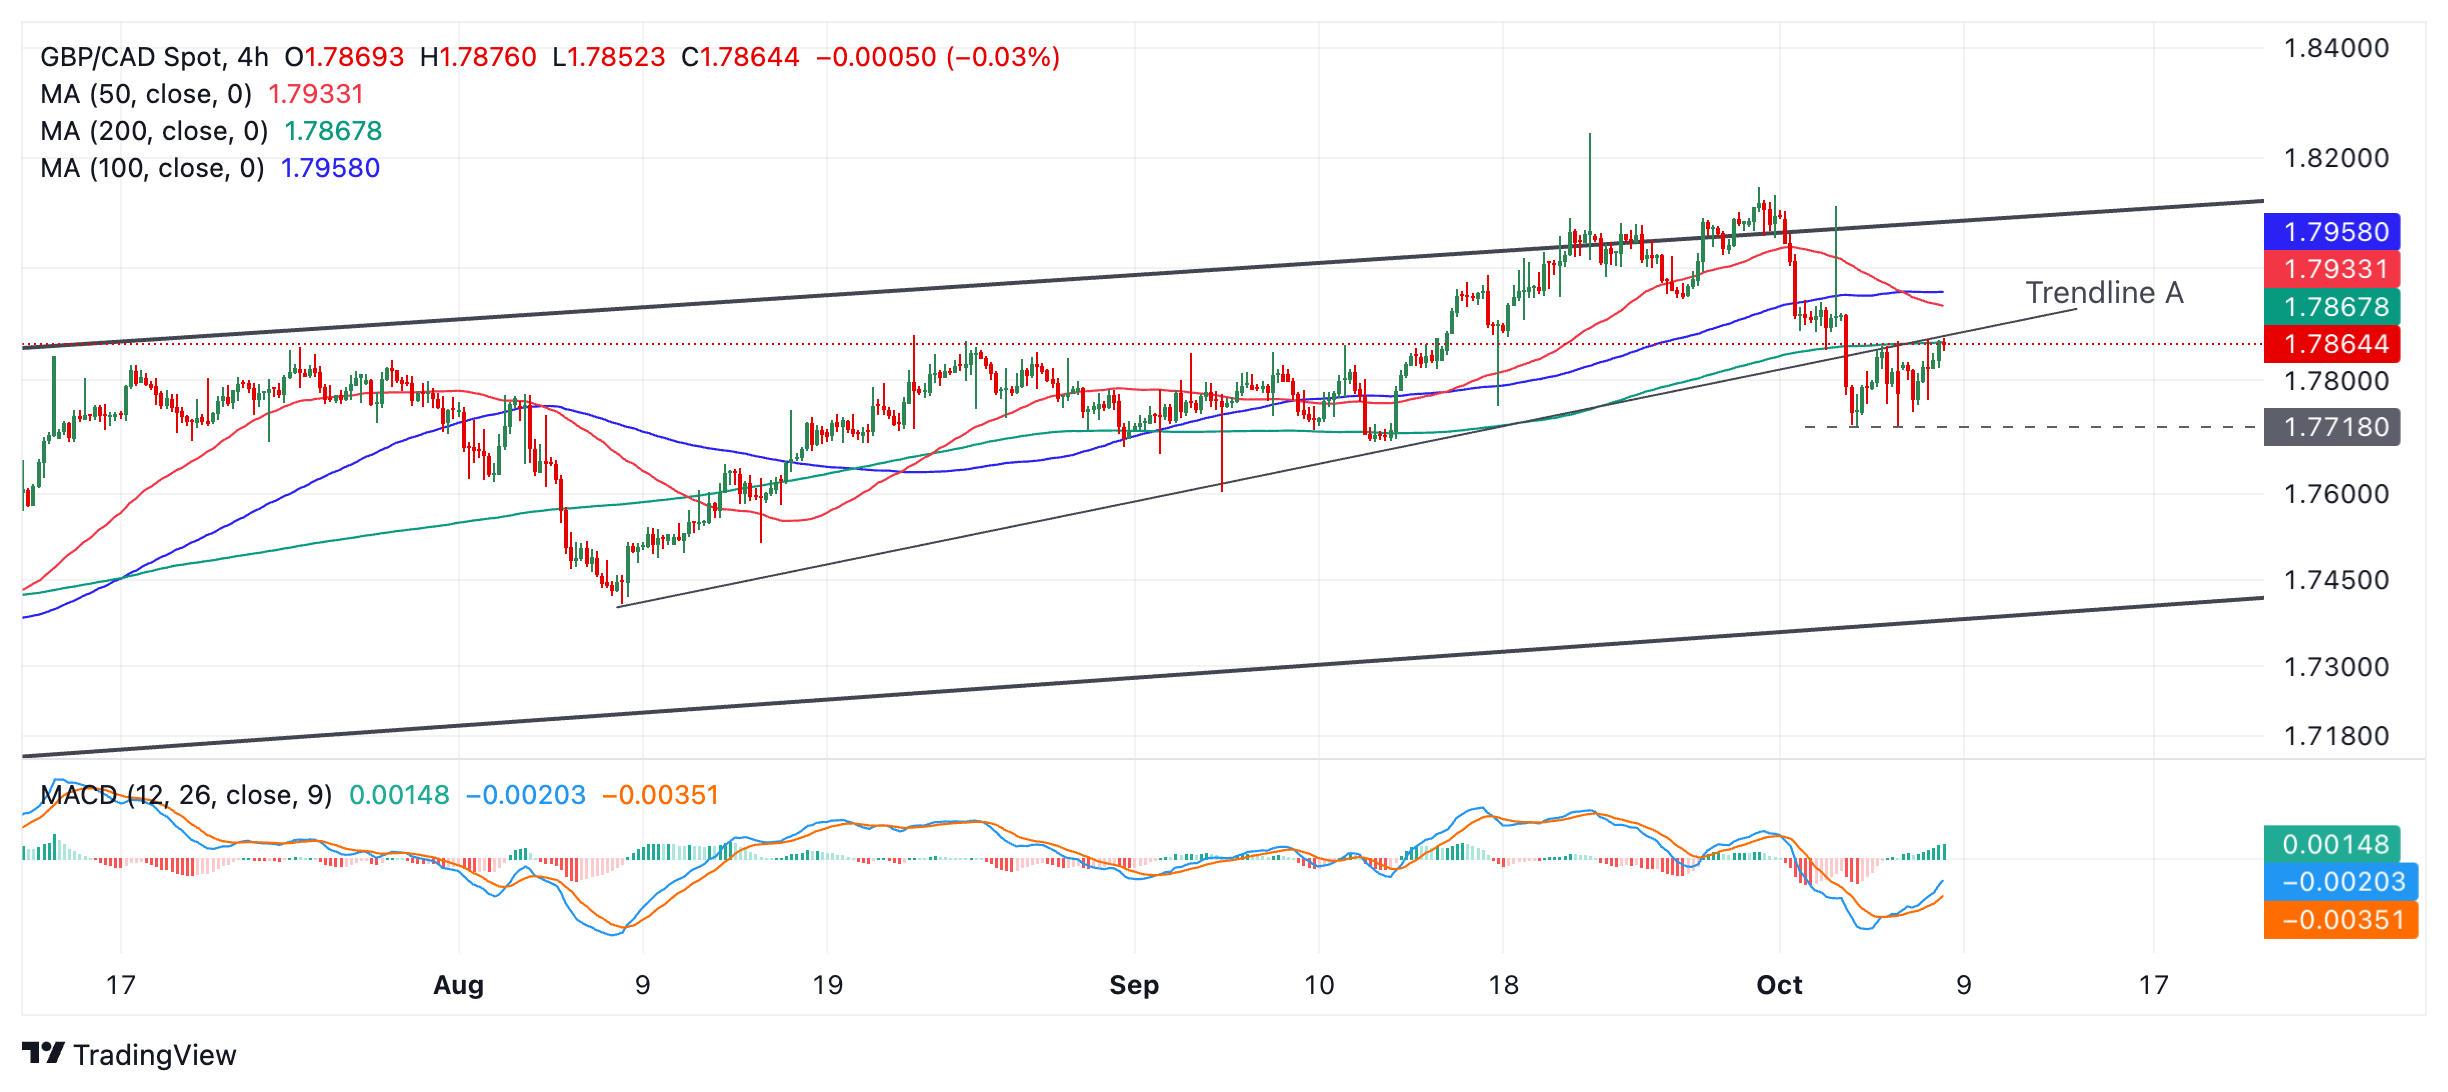
GBP/CAD is at a critical turning point: it could break back above the trend line, thus reversing the trend, or turn around and continue lower.
A break below the base of the consolidation (dashed line on the chart) would indicate a continuation of the bearish leg. Such a move would be expected to reach an initial bearish target at 1.7620 (Fibonacci 61.8% of range height extrapolated to the downside), followed by approximately 1.7605 (September 4 lows).
On the other hand, a decisive break above the trend line would suggest a trend reversal. This is possible given that the medium and long-term trends are bullish and the pair is in an ascending channel. Furthermore, the Moving Average Convergence/Divergence Indicator (MACD) has crossed above its signal line and is rising sharply, indicating that strong bullish momentum is accompanying the current move.
To be decisive, such a breakout would have to be accompanied by a long green candlestick that clearly pierced the trendline and closed near its high, or three green candlesticks in a row that broke clearly above the trendline.
Source: Fx Street
I am Joshua Winder, a senior-level journalist and editor at World Stock Market. I specialize in covering news related to the stock market and economic trends. With more than 8 years of experience in this field, I have become an expert in financial reporting.


