
- The US headline CPI and core CPI both beat expectations, rising to 3.5% and 3.8% respectively in March.
- The March FOMC Minutes highlighted uncertainty about the persistence of high inflation and the effectiveness of monetary policy.
The EUR/USD pair fell to 1.0739, representing a substantial decline of 1.1%. This decline has occurred after the publication of US inflation figures, which fueled the hawkish bets of the Federal Reserve (Fed). The Minutes of the March meeting of the Federal Open Market Committee (FOMC) did not provoke any reaction.
The US Bureau of Labor Statistics (BLS) revealed on Wednesday that the country's inflation rate, reflected by the Consumer Price Index (CPI), increased from 3.2% in February to 3.5% in March on an annual basis . This exceeded the market forecast of 3.4%. The annual core CPI, which omits fluctuating food and energy costs, reflected February's growth by rising 3.8%. Both the CPI and core CPI rose 0.4% month-on-month, beating analysts' forecast of 0.3%. In reaction, US Treasury yields soared, while the odds of a June rate cut by the Fed dropped to above 20%. The mix of hawkish bets and rising yields benefited the dollar during the session.
Furthermore, the minutes of the Federal Open Market Committee revealed a general lack of confidence among participants regarding the persistence of high inflation rates, as the latest data failed to reinforce their confidence that the economy would cool and in which the inflation rate would sustainably reach the 2% reference point. With inflation red-hot, as well as the labor market, officials may change their language and gradually abandon the chances of a June rate cut by the Fed.
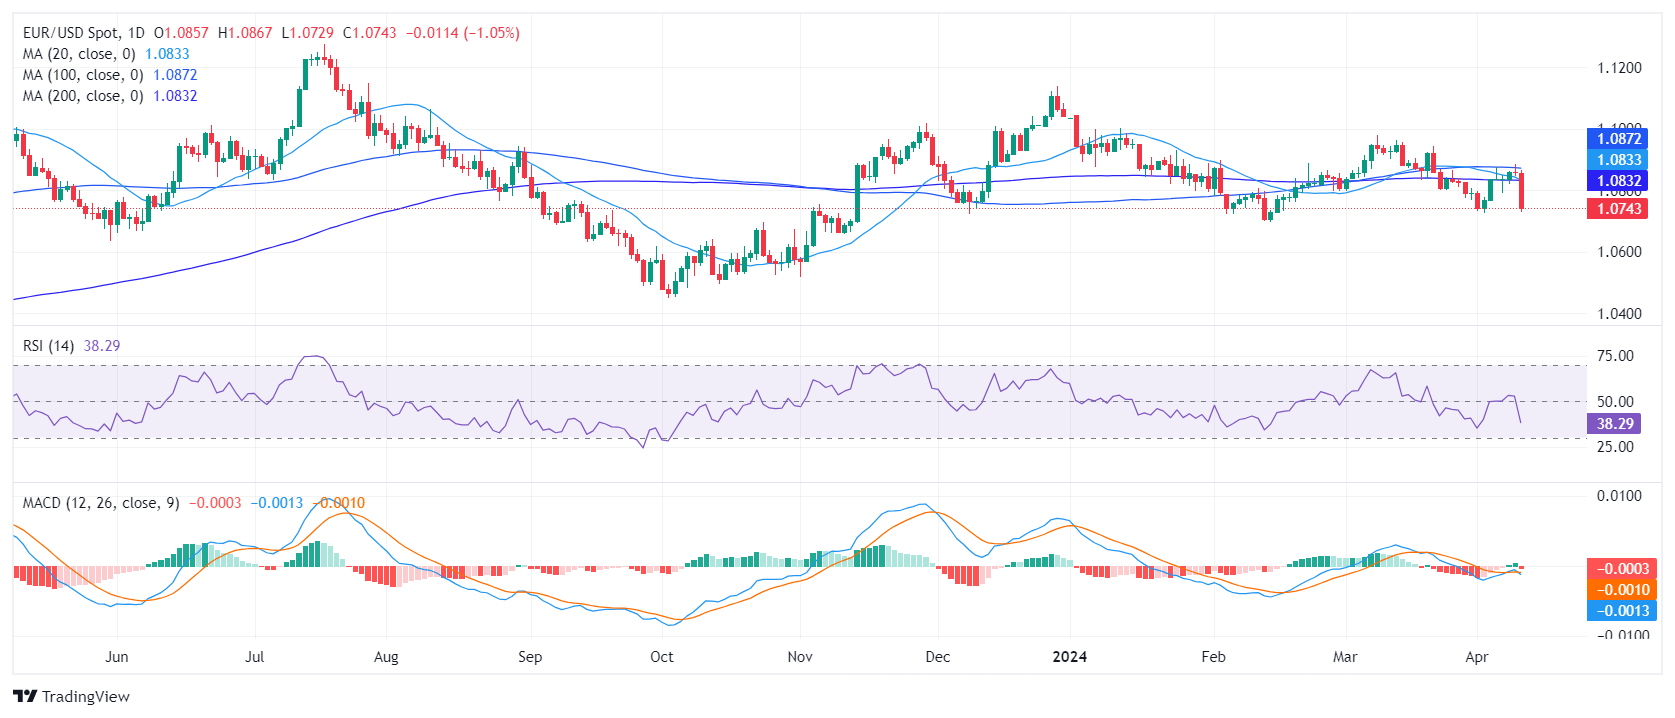
EUR/USD technical analysis
On the daily chart, the Relative Strength Index (RSI) moved into negative territory, with the latest reading at 38. This deviation from a positive trend suggests a shift in market dominance towards sellers. Along with the RSI, the Moving Average Convergence Divergence (MACD) showed a new red bar, indicating negative market momentum.
In the bigger picture, EUR/USD is also showing a bearish trend as it positions below the key simple moving averages (SMA). SMAs are tools used to smooth out significant fluctuations in price data over specific time periods to discern market trends. Specifically, today it has fallen below the 200-day SMA, normally considered a long-term trend indicator.
Source: Fx Street
I am Joshua Winder, a senior-level journalist and editor at World Stock Market. I specialize in covering news related to the stock market and economic trends. With more than 8 years of experience in this field, I have become an expert in financial reporting.


