
- EUR/USD spends Friday in familiar territory.
- The US PMI indices limited the rise of the Dollar with a mixed result.
- The USD is on track to close with weekly gains, but limited for the end of the week.
The pair EUR/USD is trading on neutral ground heading into the end of the trading week, testing the well-trodden ground near the 1.0660 area.
The US Purchasing Managers’ Index (PMI) figures were not very encouraging and caused a slight decline in the Dollar during the session on Friday, although losses remained within intraday limits.
The European PMI figures from the day before sent the Euro (EUR) back after an unexpected drop, as the manufacturing component stood at 43.4 compared to the expected 44.0.
The US manufacturing PMI came in above expectations at 48.9 for September, down from 47.9 in August, but the services component of the PMI fell to 50.2, reversing the market’s forecast for a rise to 50.6.
EUR/USD plunges after overall disappointing PMIs
For the first half of next week, the economic calendar will be very thin, although we will have to keep an eye on US Consumer Confidence on Tuesday, as well as Durable Goods Orders on Wednesday.
Market analysts see durable goods orders for August declining just 0.4% from the previous reading of -5.2%.
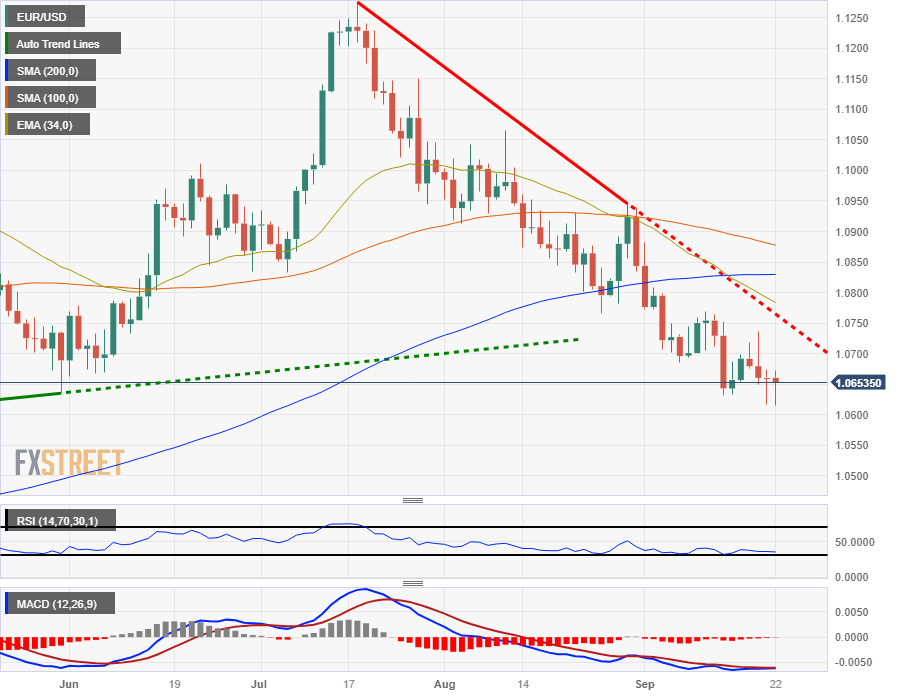
EUR/USD Technical Outlook
The Euro has moved around the 1.0660 level, but has so far not been able to significantly break above this technical level, and is on familiar ground to close out the trading week.
EUR/USD fell to Friday’s lows at 1.0615, but recovered towards the upside near Friday’s high, just north of 1.0670.
On the hourly candlesticks, EUR/USD is trading just south of the 200 hourly SMA, near 1.0685.
On the daily candlesticks, the Euro is decidedly bearish, continuing to decline through the 200-day SMA and almost 5.5% from the July high near 1.1275.
The 34-day EMA is about to confirm a bearish crossover of the 200-day SMA, and investors could watch for a recovery to an important technical level before resuming another leg lower.
EUR/USD Daily Chart
EUR/USD technical levels
Source: Fx Street
I am Joshua Winder, a senior-level journalist and editor at World Stock Market. I specialize in covering news related to the stock market and economic trends. With more than 8 years of experience in this field, I have become an expert in financial reporting.


