
- EUR/USD fails to extend the bounce beyond the 1.0780 level.
- The 3-month line near 1.0780 continues to limit the upside.
He EUR/USD rebounds from Tuesday’s lows near 1.0670, though bullish attempt runs out near 1.0760.
As long as the 3-month resistance line near 1.0780 continues to cap further upside, the pair is expected to remain under pressure and therefore another move towards the February low near 1.0670 should not be ruled out yet.
Longer-term, the constructive view remains as long as it holds above the 200-day SMA, today at 1.0319.
EUR/USD daily chart
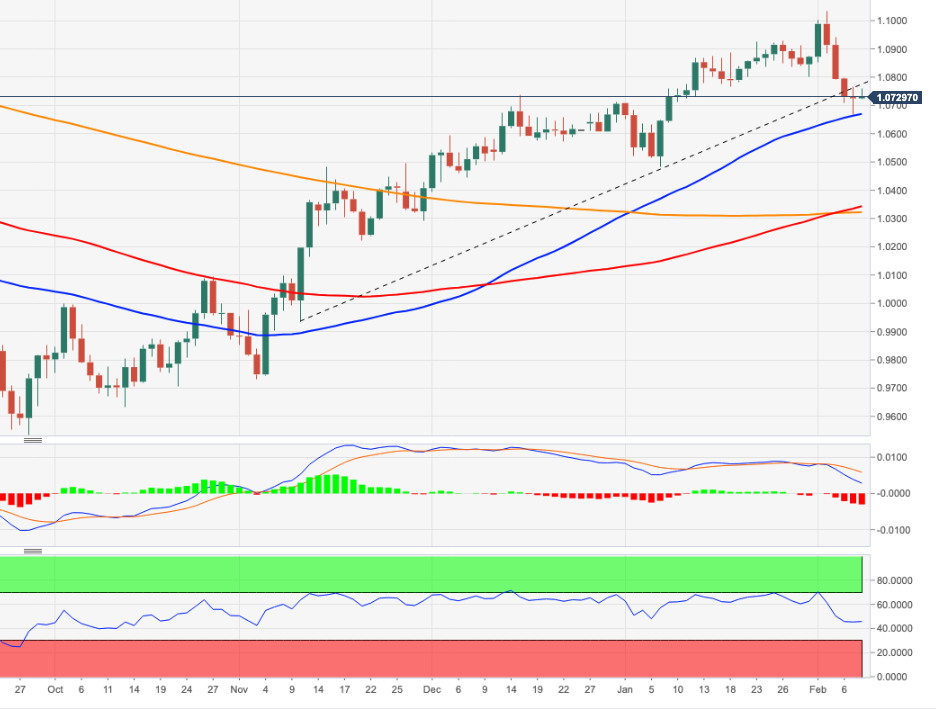
Source: Fx Street
I am Joshua Winder, a senior-level journalist and editor at World Stock Market. I specialize in covering news related to the stock market and economic trends. With more than 8 years of experience in this field, I have become an expert in financial reporting.


