
- EUR/USD is under pressure again near 1.0150.
- The 1.0370/80 area caps the upside for now.
The EUR/USD go back to the bottom of the weekly range near 1.0150 and moderates at the same time as Tuesday’s timid advance.
As long as it is below the 1.0370/80 area, the region where the August high and the 6-month resistance line converge, the pair is expected to remain under downward pressure. That said, the lower end of the recent range in the 1.0100 area should contain the decline ahead of a potential challenge to the psychological parity level.
In the long term, the bearish view on the pair is expected to prevail as long as it trades below the 200-day SMA at 1.0873.
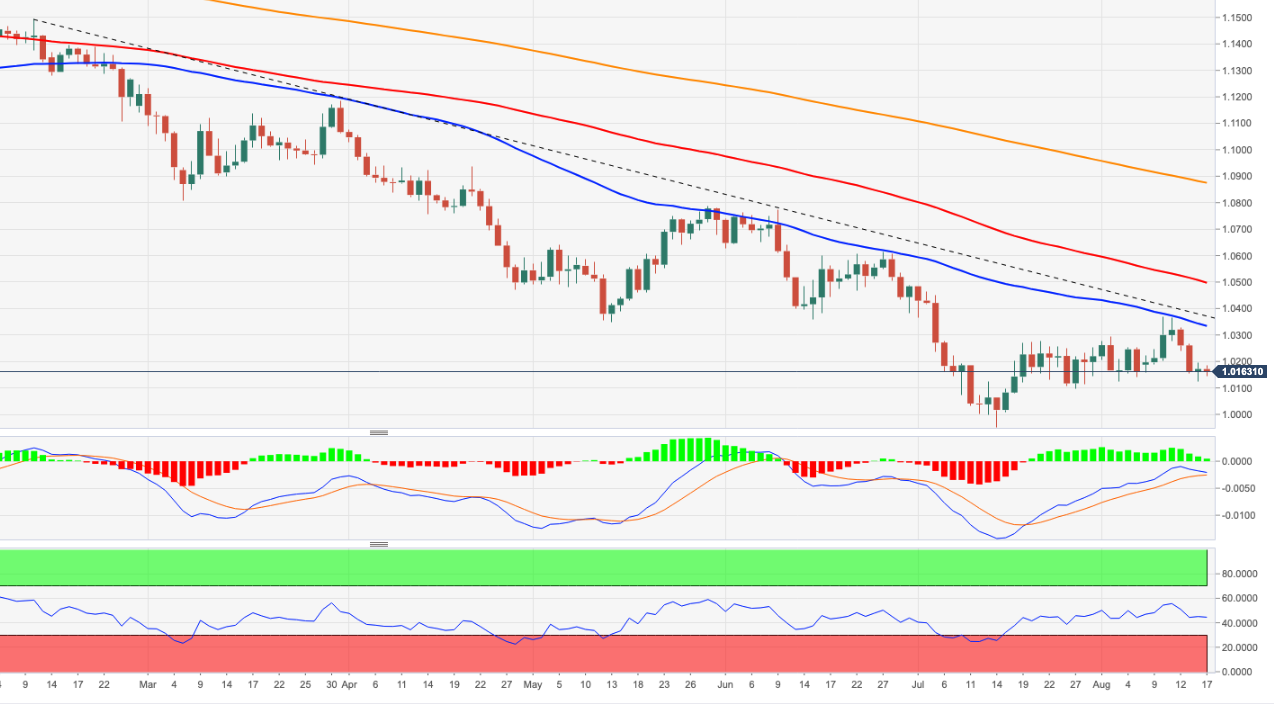
EUR/USD daily chart
Technical levels
Source: Fx Street
With 6 years of experience, I bring to the table captivating and informative writing in the world news category. My expertise covers a range of industries, including tourism, technology, forex and stocks. From brief social media posts to in-depth articles, I am dedicated to creating compelling content for various platforms.


