
- EUR/USD could find immediate resistance at the 38.2% Fibonacci retracement at 1.0864.
- The MACD indicator implies a possible shift towards bullish momentum for the pair.
- The key support zone lies around the 21-day EMA at 1.0814 and the round level of 1.0800.
The EUR/USD pair continues its winning streak that began on February 14, with the US Dollar (USD) declining possibly influenced by lower US Treasury yields. Consequently, during the European session on Tuesday, the EUR/USD pair is hovering around the 1.0850 area.
Immediate resistance levels for the EUR/USD pair are identified at the 38.2% Ffibonacci retracement at 1.0864, followed by the February high at 1.0897, which aligns with the important psychological barrier at 1.0900.
Technical analysis suggests bullish sentiment for the EUR/USD pair. The 14-day Relative Strength Index (RSI) is positioned above the 50 level, indicating strength in the bullish momentum.
Furthermore, the MACD indicator shows a divergence above the signal line, despite being below the center line. This lagging indicator implies a possible shift towards bullish momentum for the EUR/USD pair.
On the downside, the EUR/USD pair could find key support around the 21-day EMA at 1.0814, followed by support at the round level of 1.0800. A break below this level could lead the pair to retest the February low at 1.0694.
EUR/USD daily chart
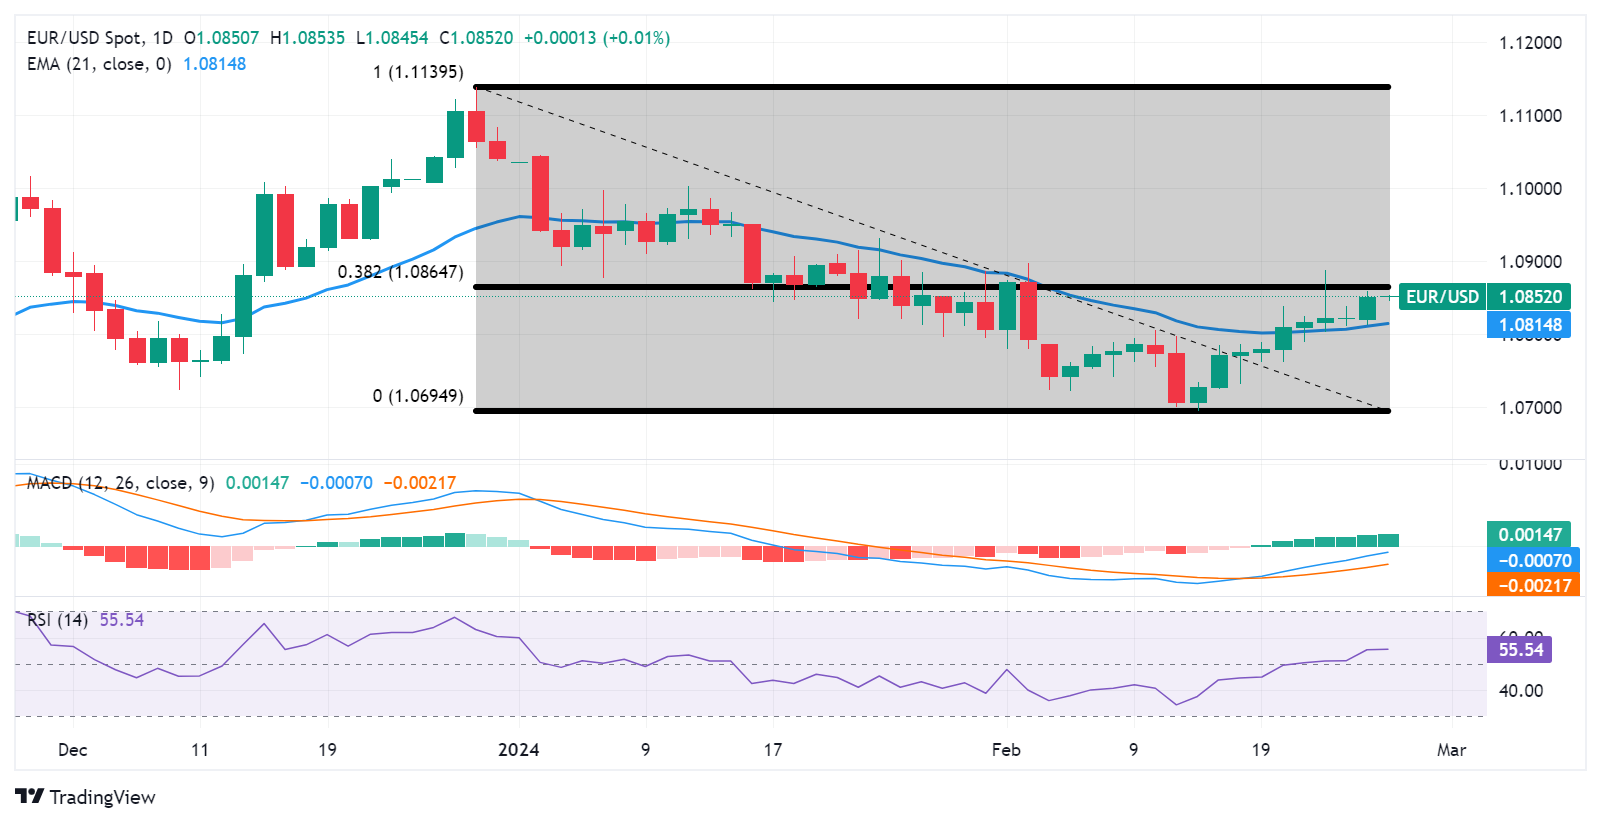
Source: Fx Street
I am Joshua Winder, a senior-level journalist and editor at World Stock Market. I specialize in covering news related to the stock market and economic trends. With more than 8 years of experience in this field, I have become an expert in financial reporting.

")


