
- EUR/USD accelerates losses to near 1.0600 support.
- A sustained loss of momentum exposes a visit to the 2023 low.
He EUR/USD falls to multi-week lows in the 1.0610 area by the end of the week.
If the selling pressure gains further momentum, the pair could test the round 1.0600 level in the short term. A break of this level could lead to a possible test of the yearly low at 1.0481 (Jan 6).
For now, bearish sentiment is expected to persist as long as the 3-month resistance line, near 1.0880 today, caps further gains.
Longer-term, the constructive view remains as long as it holds above the 200-day SMA, today at 1.0326.
EUR/USD daily chart
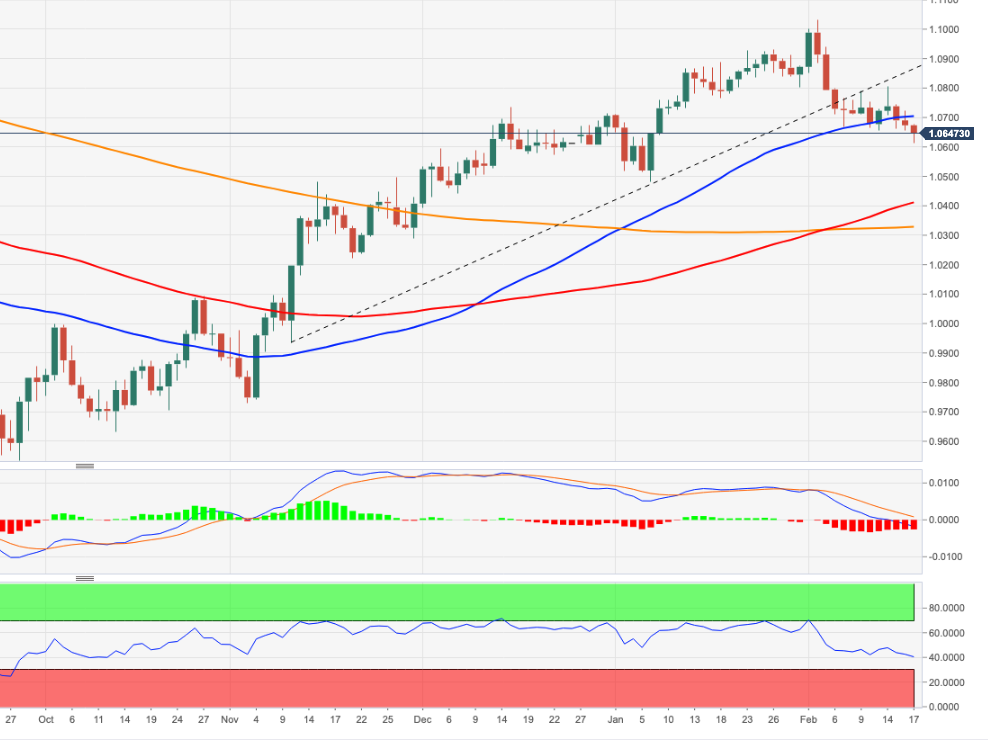
Source: Fx Street
I am Joshua Winder, a senior-level journalist and editor at World Stock Market. I specialize in covering news related to the stock market and economic trends. With more than 8 years of experience in this field, I have become an expert in financial reporting.


