
- EUR/USD falters once again just ahead of 1.0600.
- Further recovery should target the monthly high at 1.0641.
EUR/USD alternates gains with losses in the area below 1.0600 on Friday.
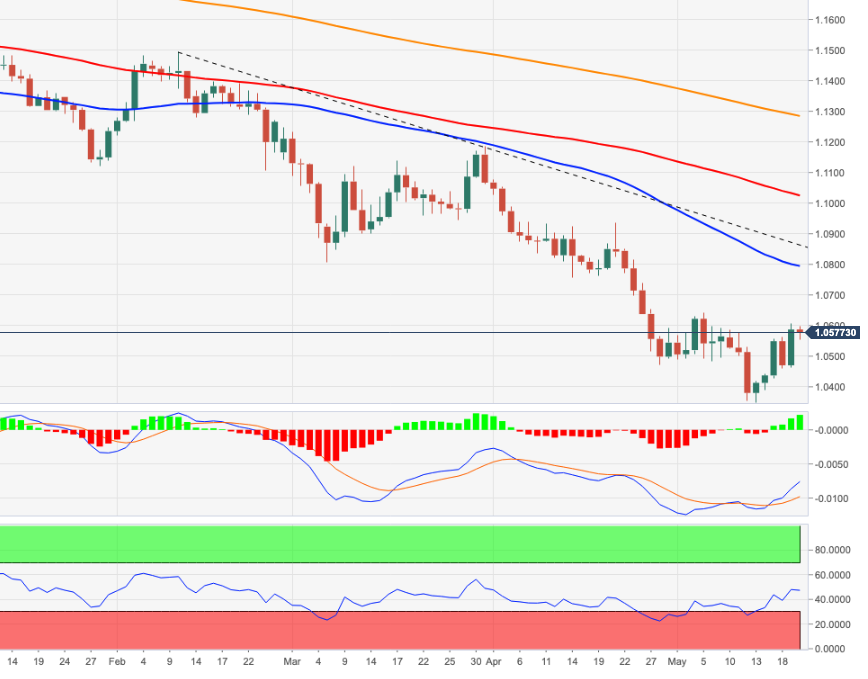
Considering the current price action of the pair, a continuation of the bounce is likely to happen in the very short term. That said, the next upside barrier emerges at the May high at 1.0641 (May 5) before the interim hurdle at the 55-day SMA today at 1.0792.
Below the three-month line near 1.0860, the pair is expected to remain under pressure and vulnerable to further losses.
EUR/USD day chart
Source: Fx Street
With 6 years of experience, I bring to the table captivating and informative writing in the world news category. My expertise covers a range of industries, including tourism, technology, forex and stocks. From brief social media posts to in-depth articles, I am dedicated to creating compelling content for various platforms.


